Uni Arts
University Ave between Henry St and Seymour St. Historical counter. Last seen 2025-05-01.
All-time total
185,562
Last seen
2025-05-01
Status
Inactive
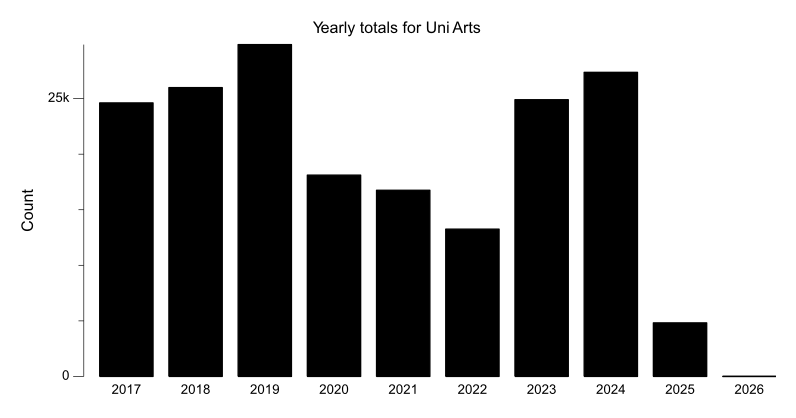
Yearly Totals
Annual totals for this counter across its full history.
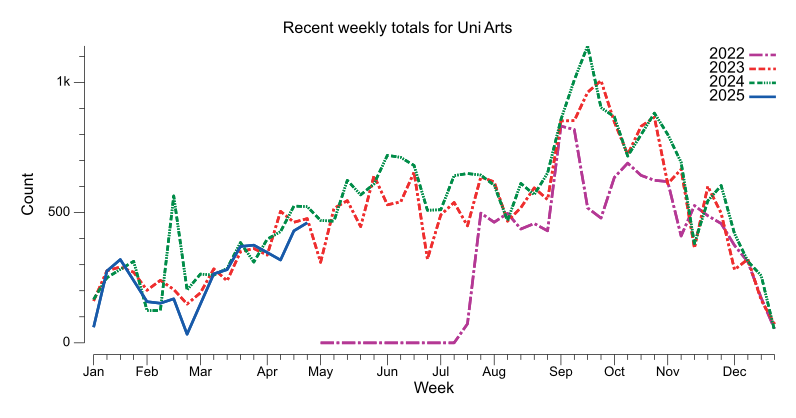
Recent Weekly Trend
Weekly totals grouped by recent years for seasonality comparison.
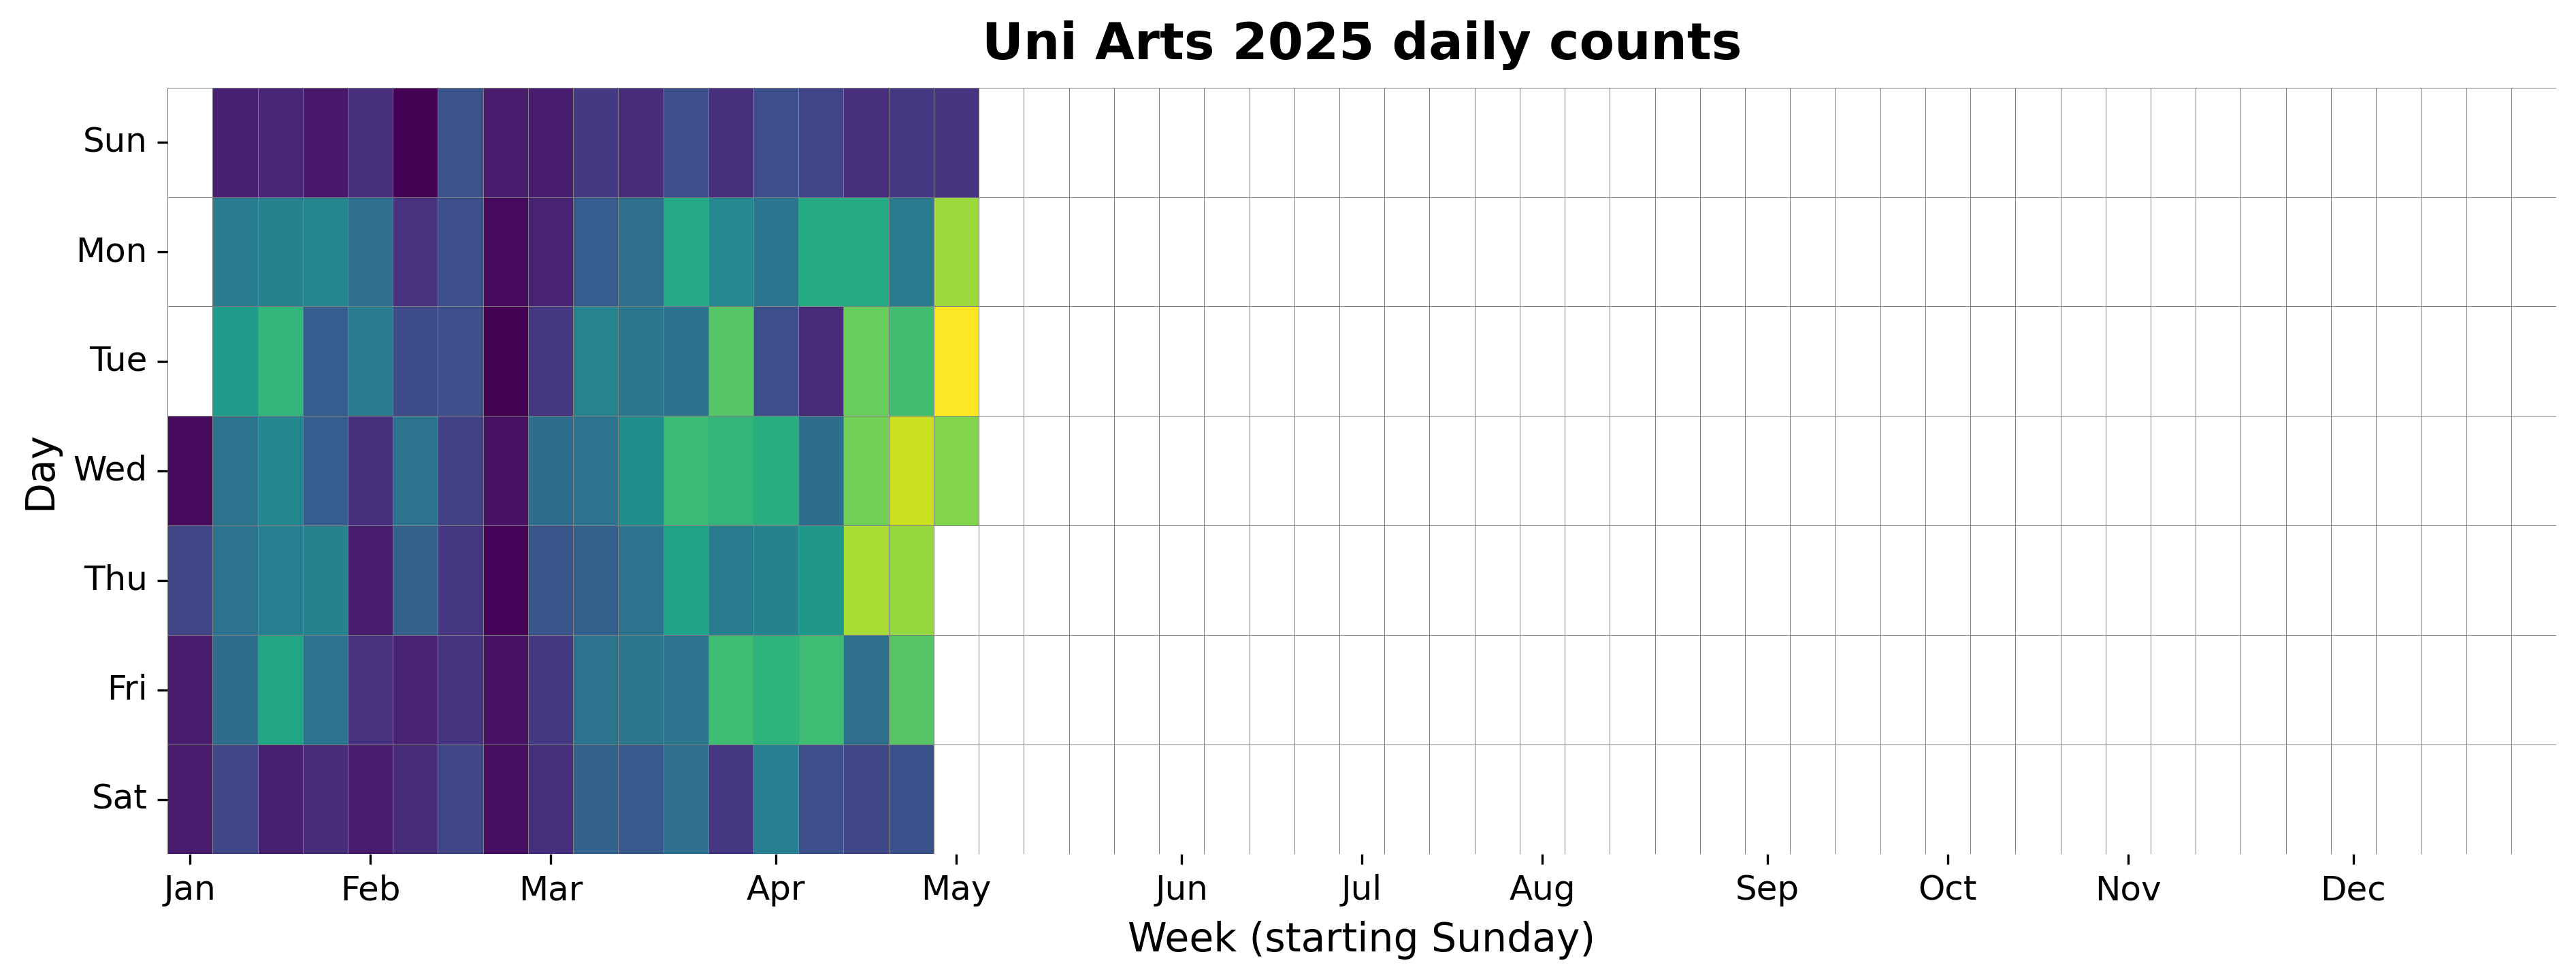
2025 Daily Heatmap
Each cell shows the daily count for a week/day combination.
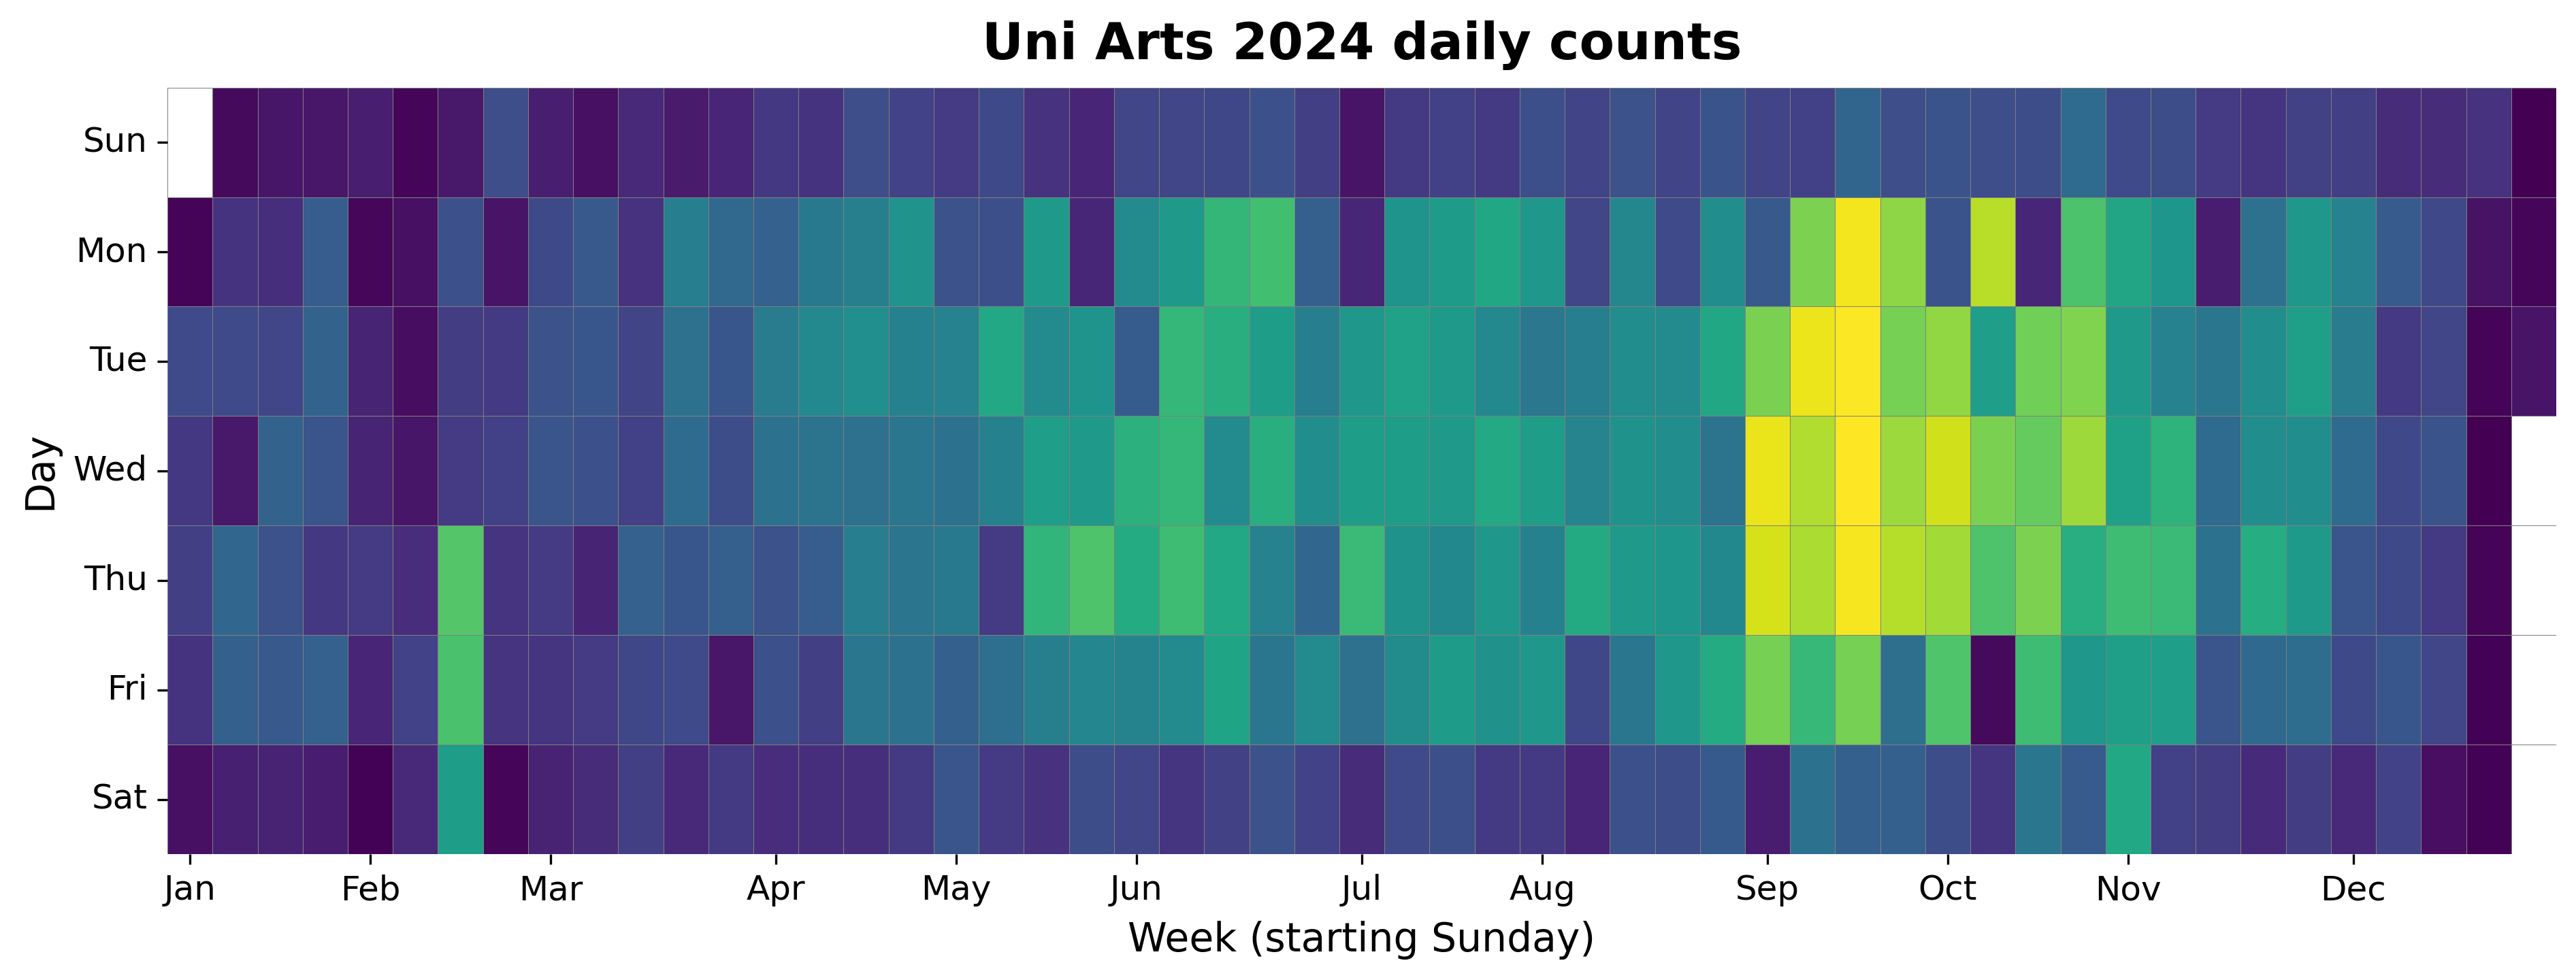
2024 Daily Heatmap
Each cell shows the daily count for a week/day combination.
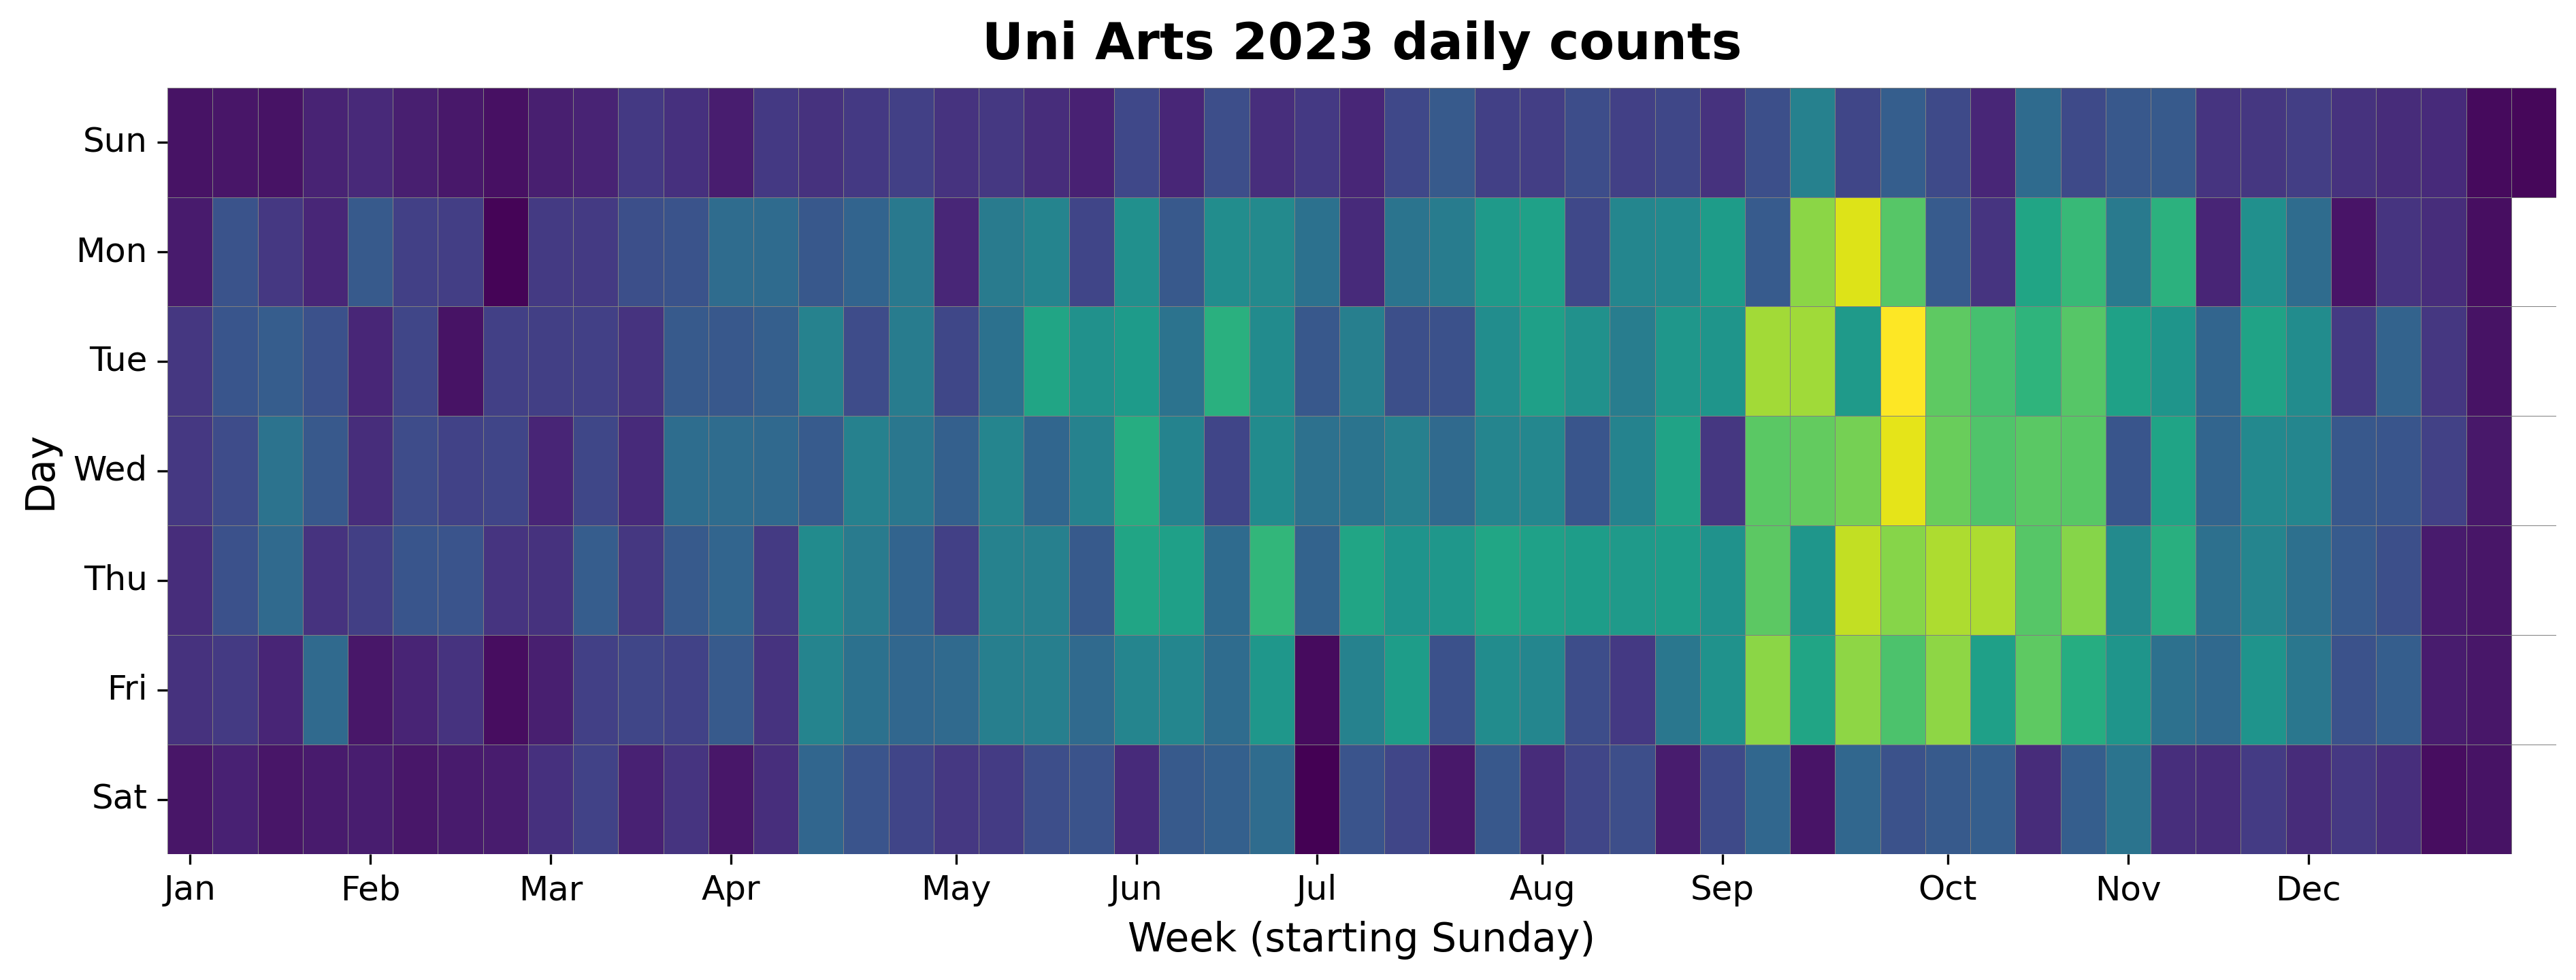
2023 Daily Heatmap
Each cell shows the daily count for a week/day combination.
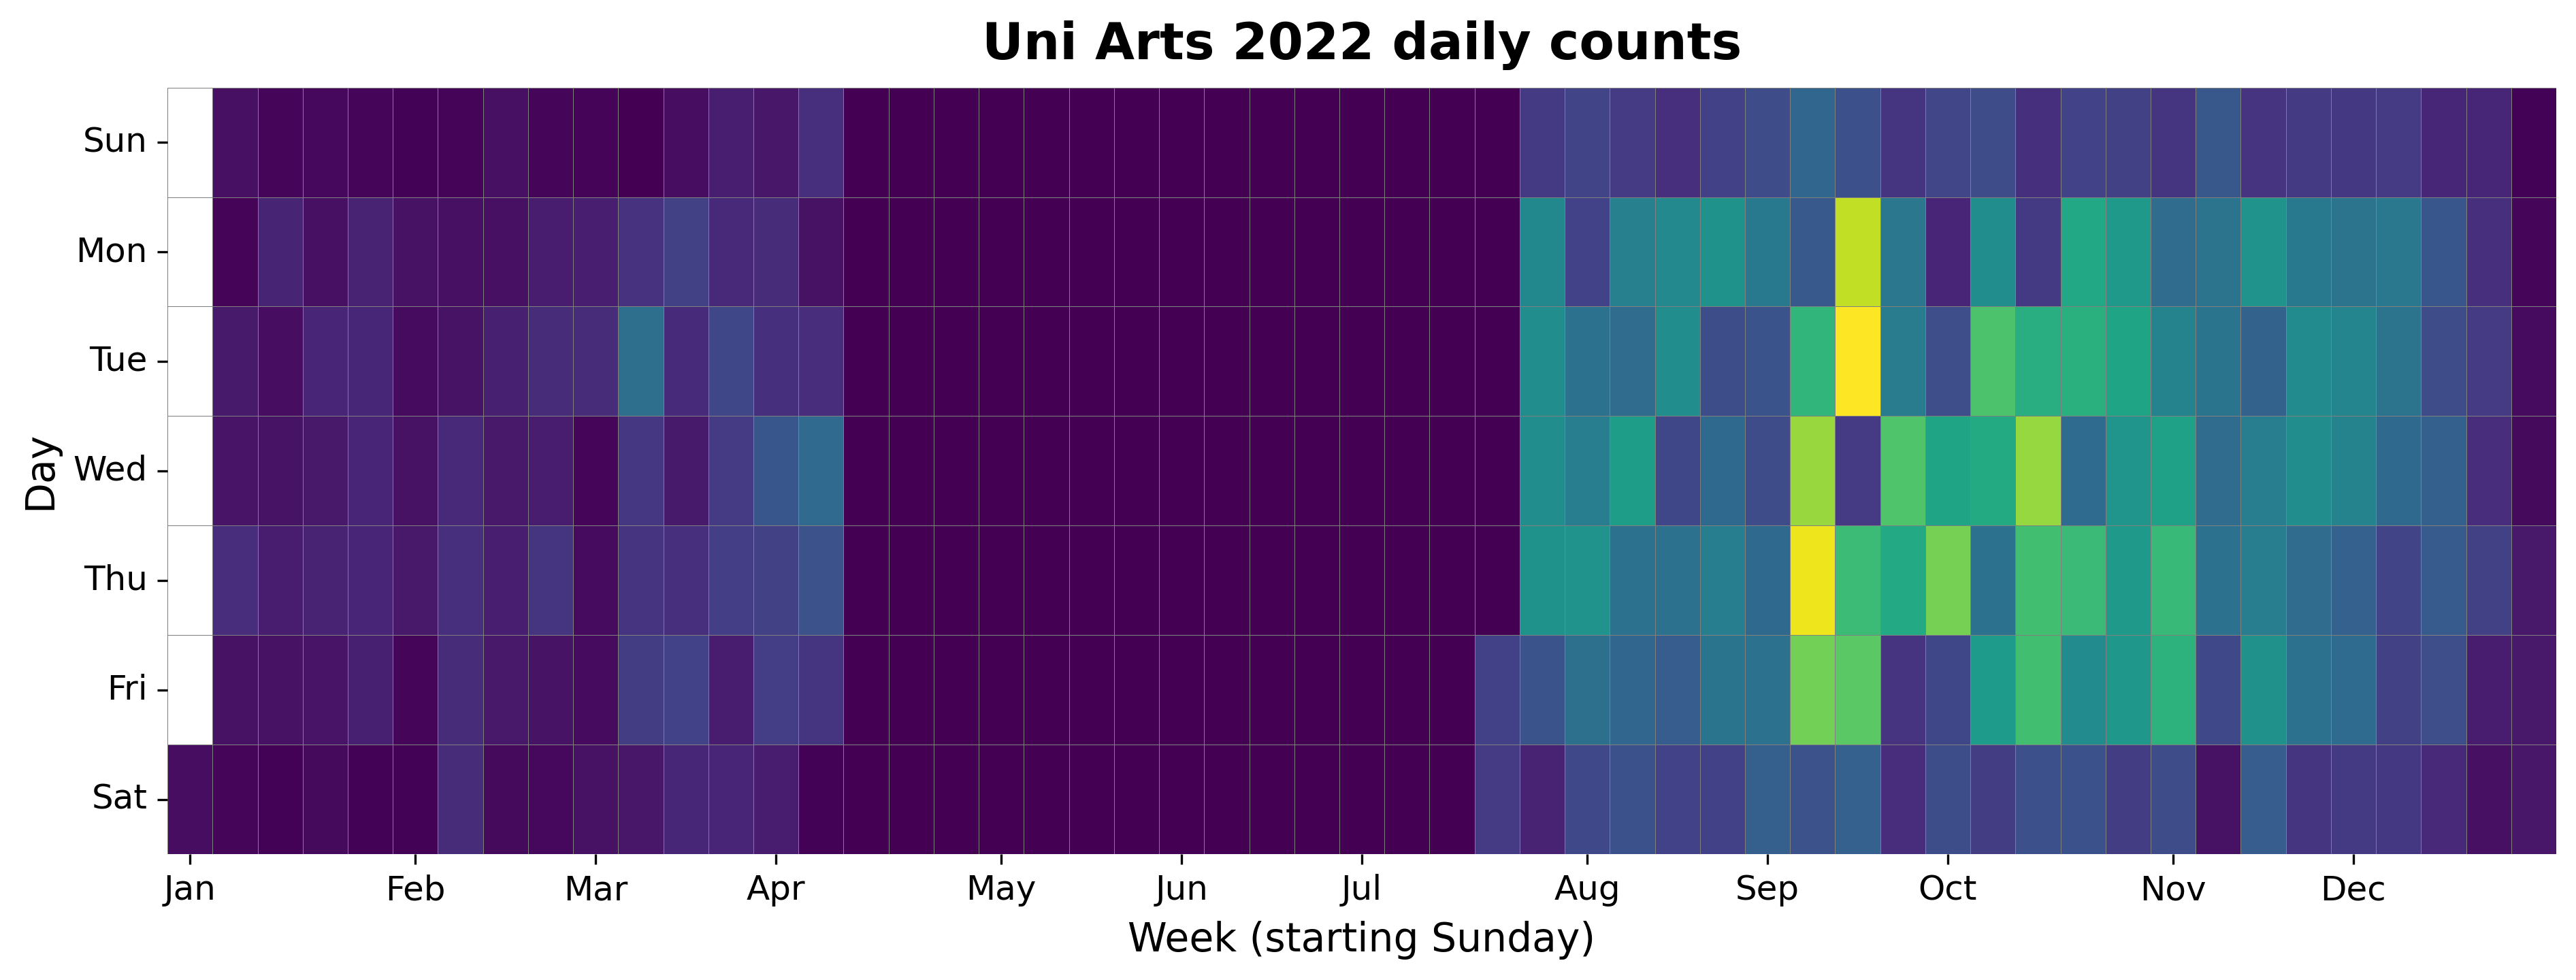
2022 Daily Heatmap
Each cell shows the daily count for a week/day combination.
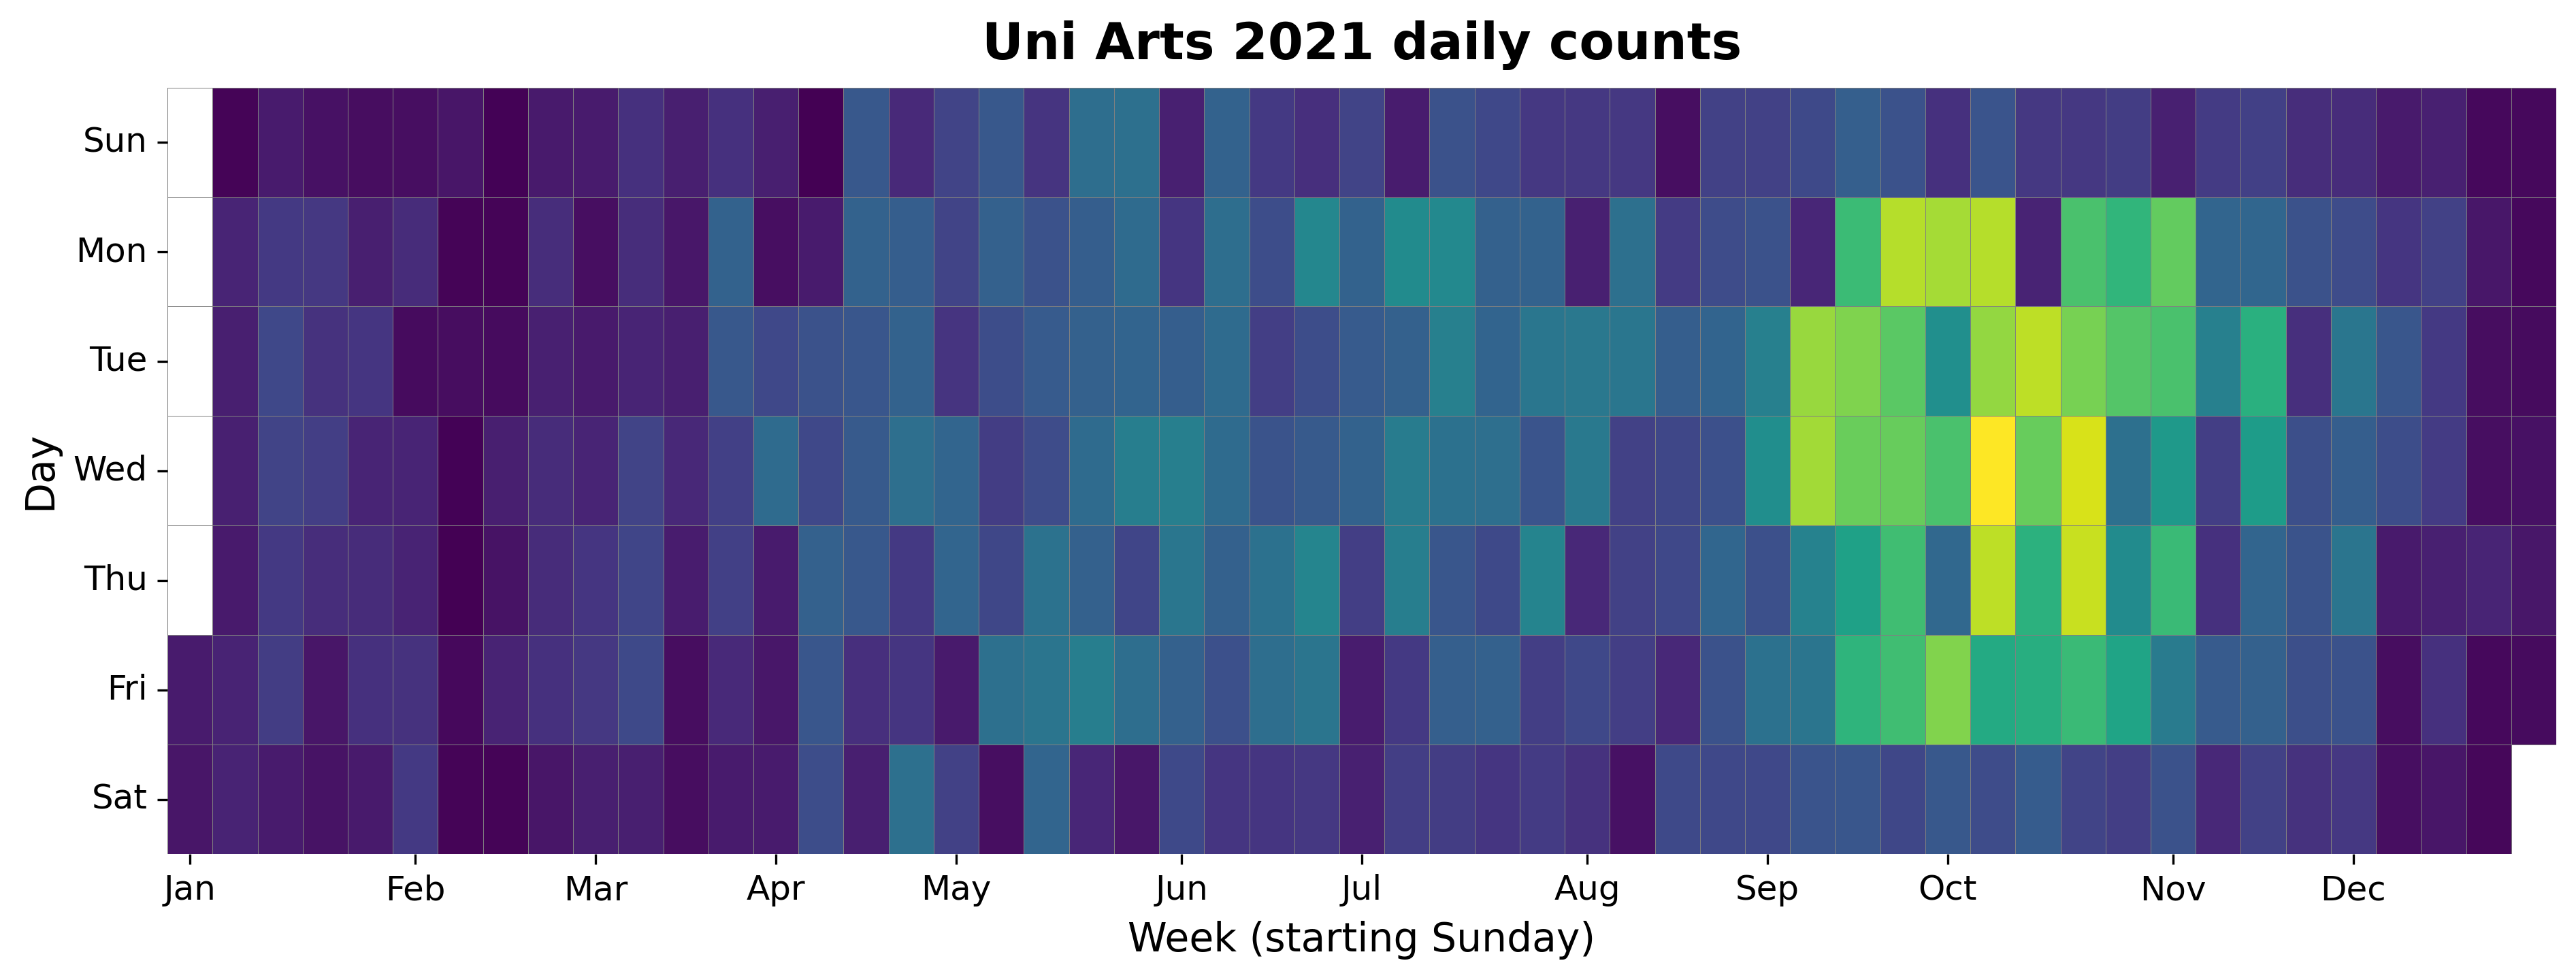
2021 Daily Heatmap
Each cell shows the daily count for a week/day combination.
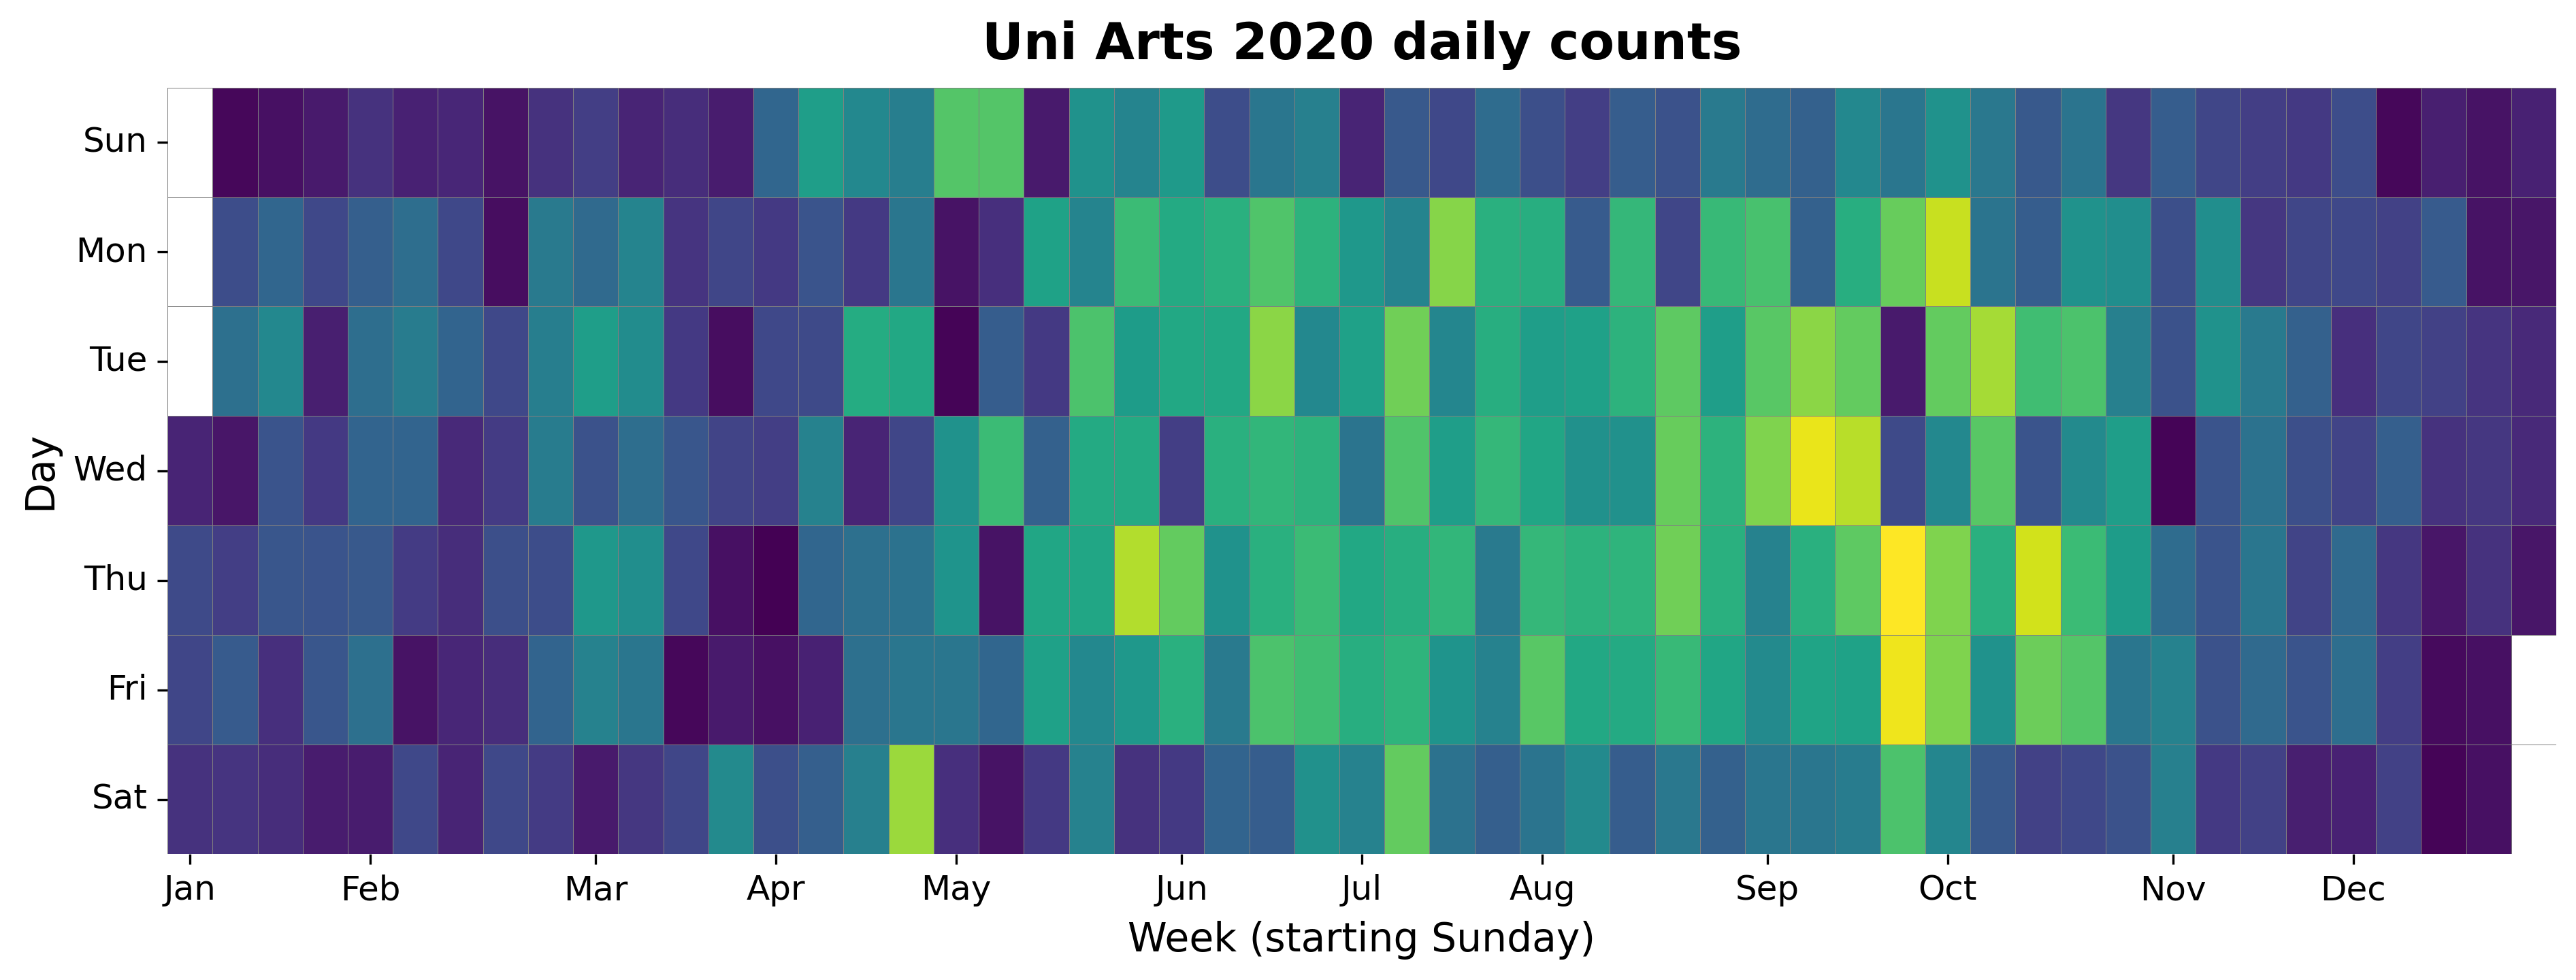
2020 Daily Heatmap
Each cell shows the daily count for a week/day combination.
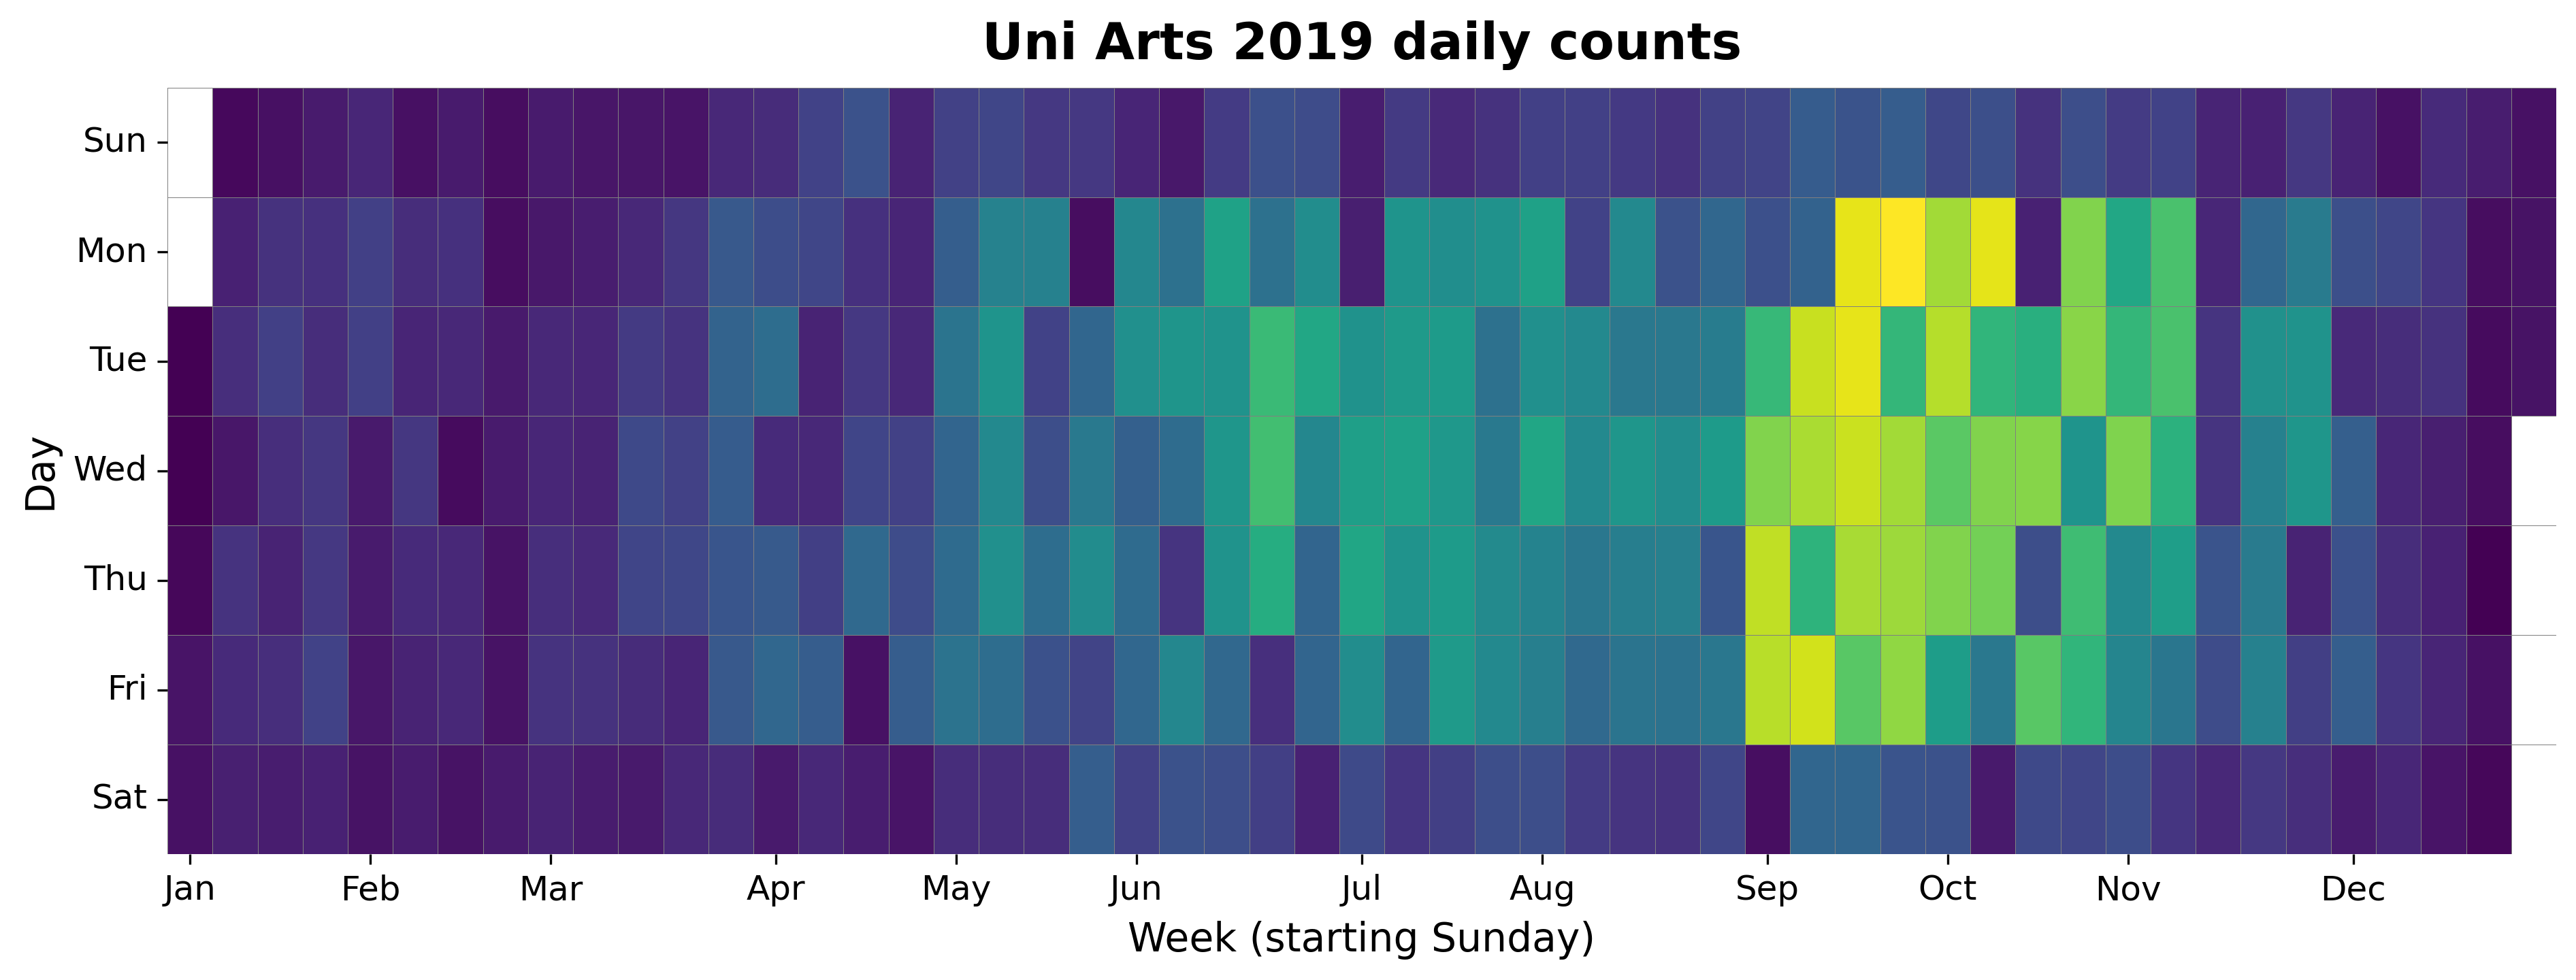
2019 Daily Heatmap
Each cell shows the daily count for a week/day combination.
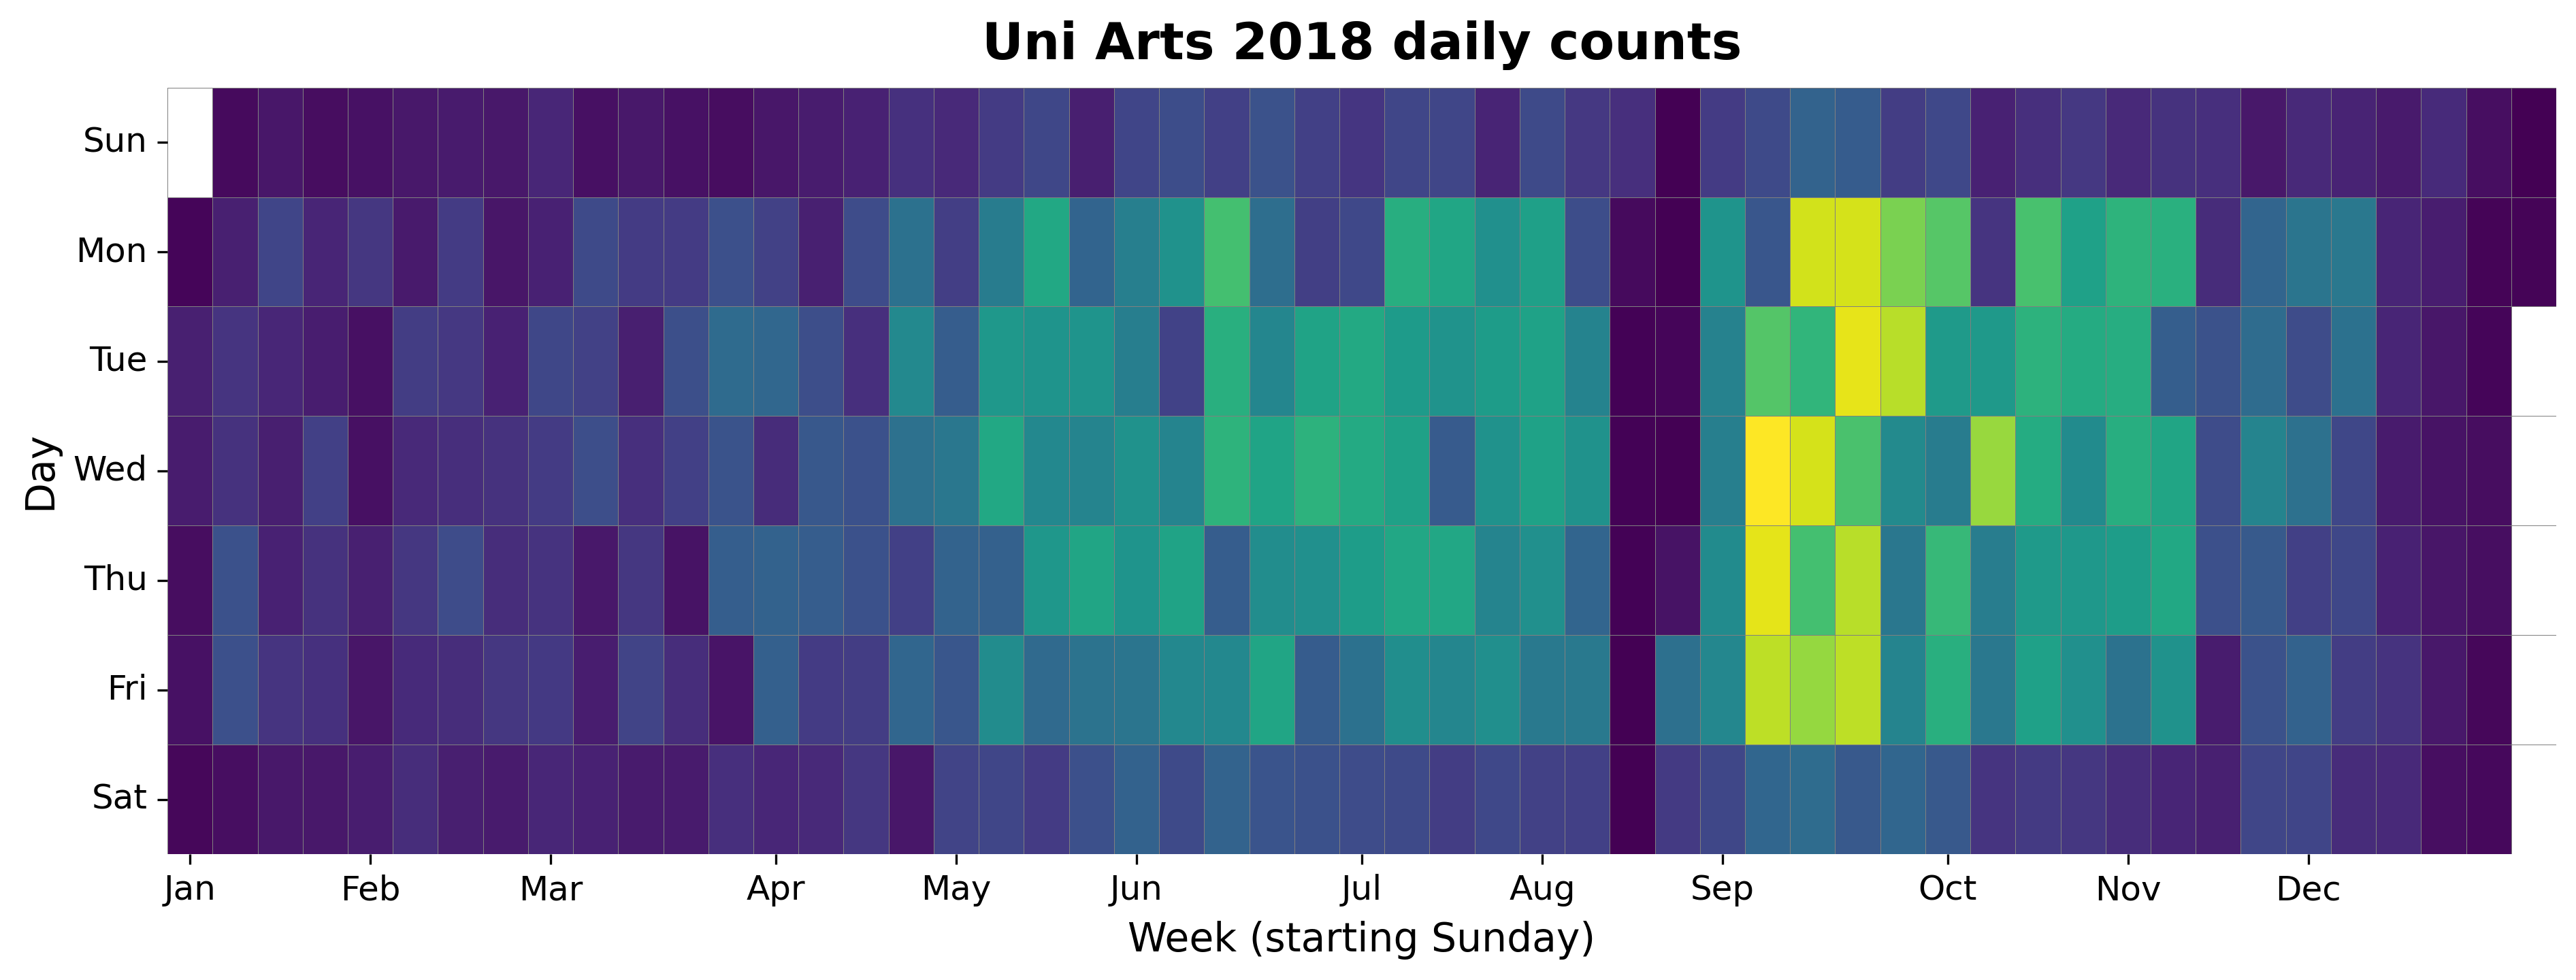
2018 Daily Heatmap
Each cell shows the daily count for a week/day combination.
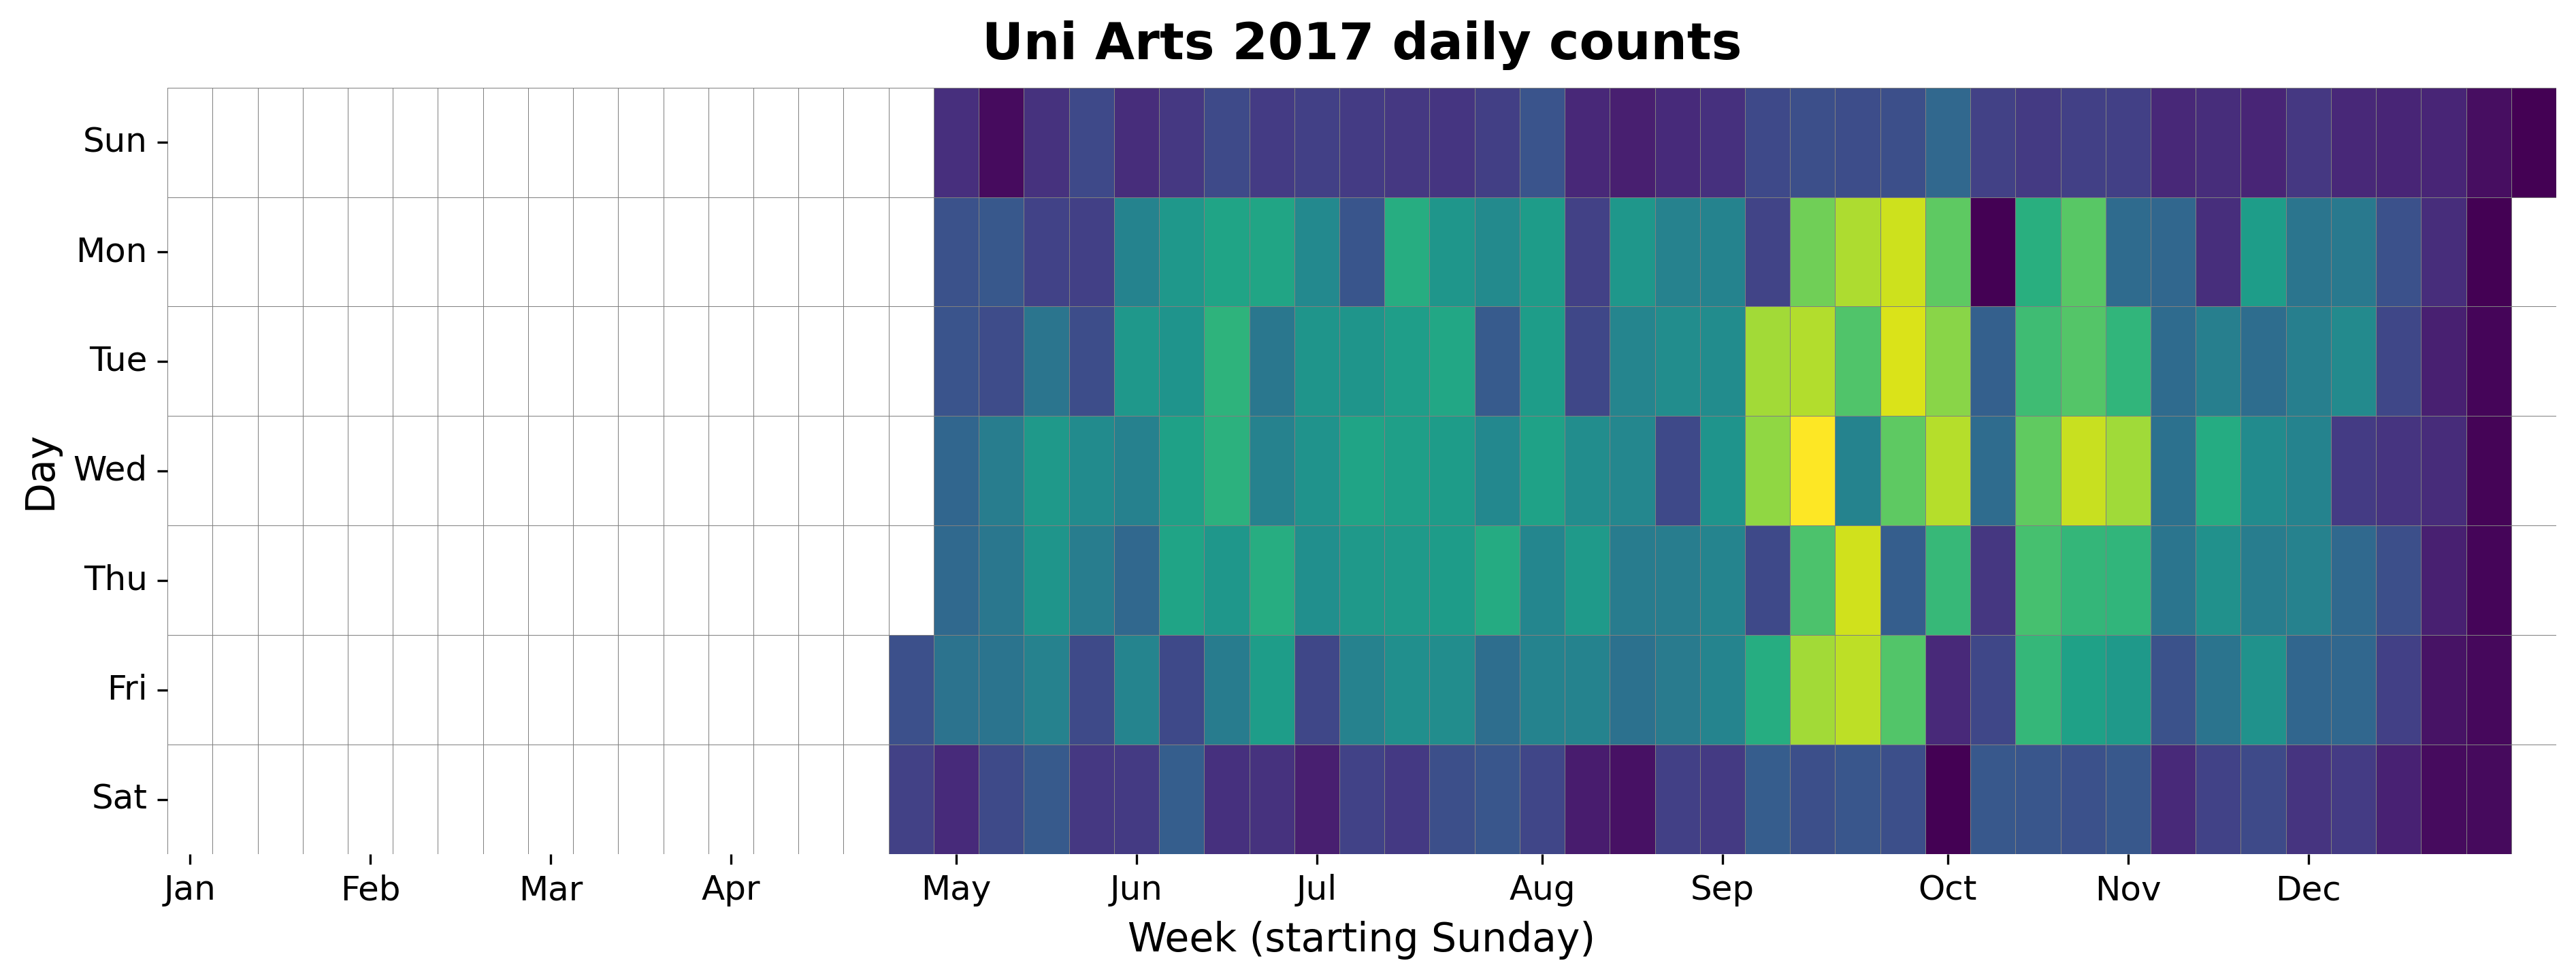
2017 Daily Heatmap
Each cell shows the daily count for a week/day combination.
Top Days
| Day | Count |
|---|---|
| 2019-09-23 | 277 |
| 2019-09-17 | 267 |
| 2019-09-16 | 267 |
| 2019-10-07 | 266 |
| 2017-09-13 | 265 |
| 2019-09-13 | 258 |
| 2019-09-18 | 255 |
| 2019-09-10 | 254 |
| 2019-09-05 | 251 |
| 2017-09-26 | 250 |
Top Weeks
| Week Starting | Count |
|---|---|
| 2019-09-15 | 1,396 |
| 2019-09-22 | 1,319 |
| 2017-09-10 | 1,253 |
| 2018-09-16 | 1,226 |
| 2019-09-29 | 1,197 |
| 2019-09-08 | 1,189 |
| 2018-09-09 | 1,168 |
| 2017-09-17 | 1,161 |
| 2024-09-15 | 1,140 |
| 2017-09-24 | 1,093 |
Top Months
| Month | Count |
|---|---|
| 2019-09 | 5,245 |
| 2019-10 | 4,624 |
| 2017-09 | 4,531 |
| 2018-09 | 4,458 |
| 2024-09 | 4,017 |
| 2023-09 | 3,828 |
| 2017-10 | 3,764 |
| 2024-10 | 3,712 |
| 2023-10 | 3,532 |
| 2018-10 | 3,525 |