South Park
Both sides of South Park St just south of Spring Garden Rd. Data through 2026-07-19.
Jul 19
200
Trailing 7 days
2,422
Jul to date
6,573
2026 total
32,355
All-time total
554,721
Last seen
2026-07-20
Status
Active
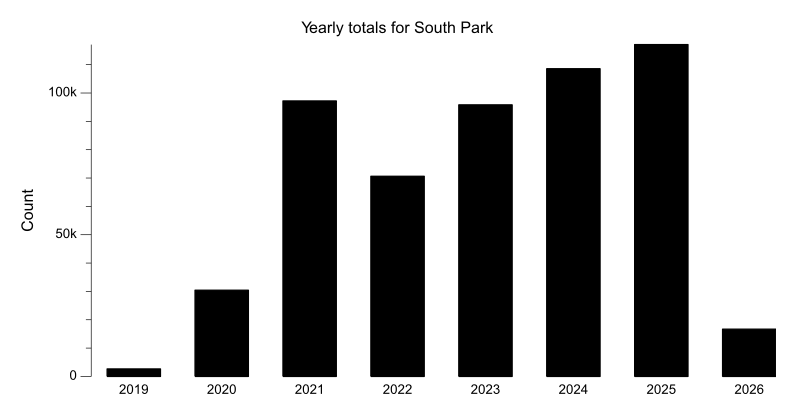
Yearly Totals
Annual totals for this counter across its full history.
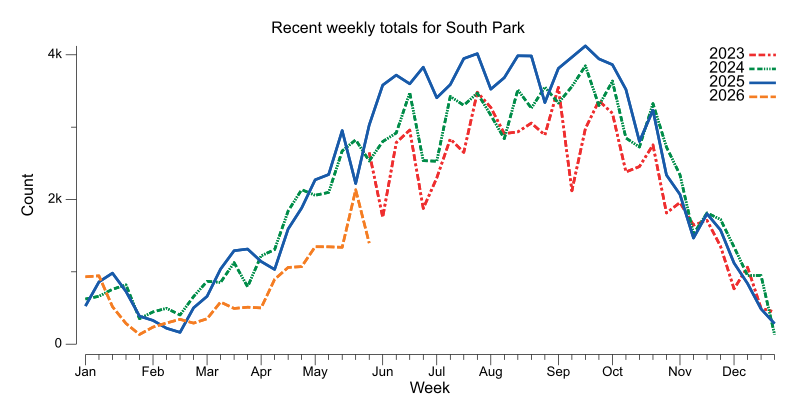
Recent Weekly Trend
Weekly totals grouped by recent years for seasonality comparison.
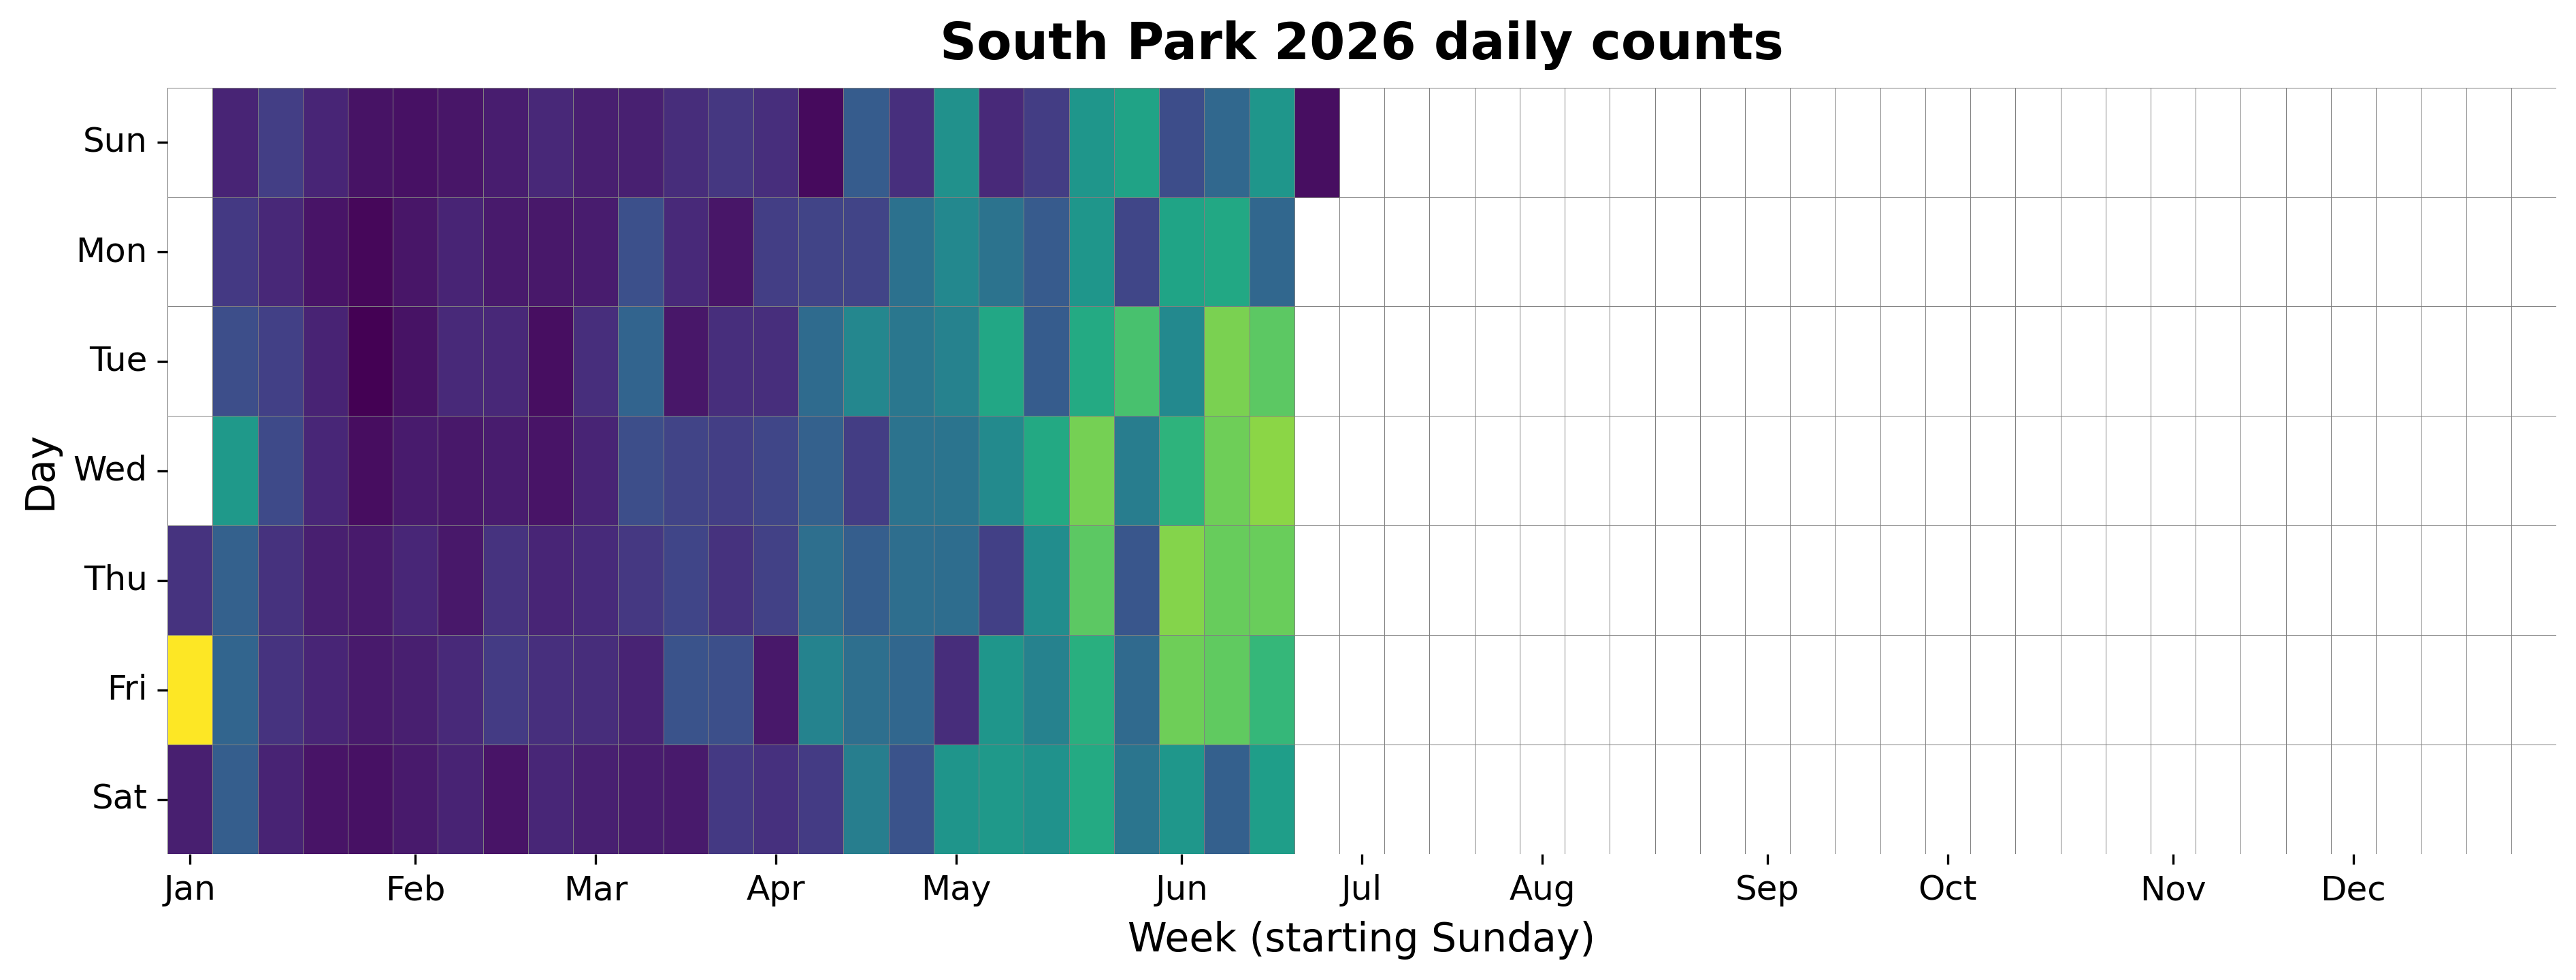
2026 Daily Heatmap
Each cell shows the daily count for a week/day combination.
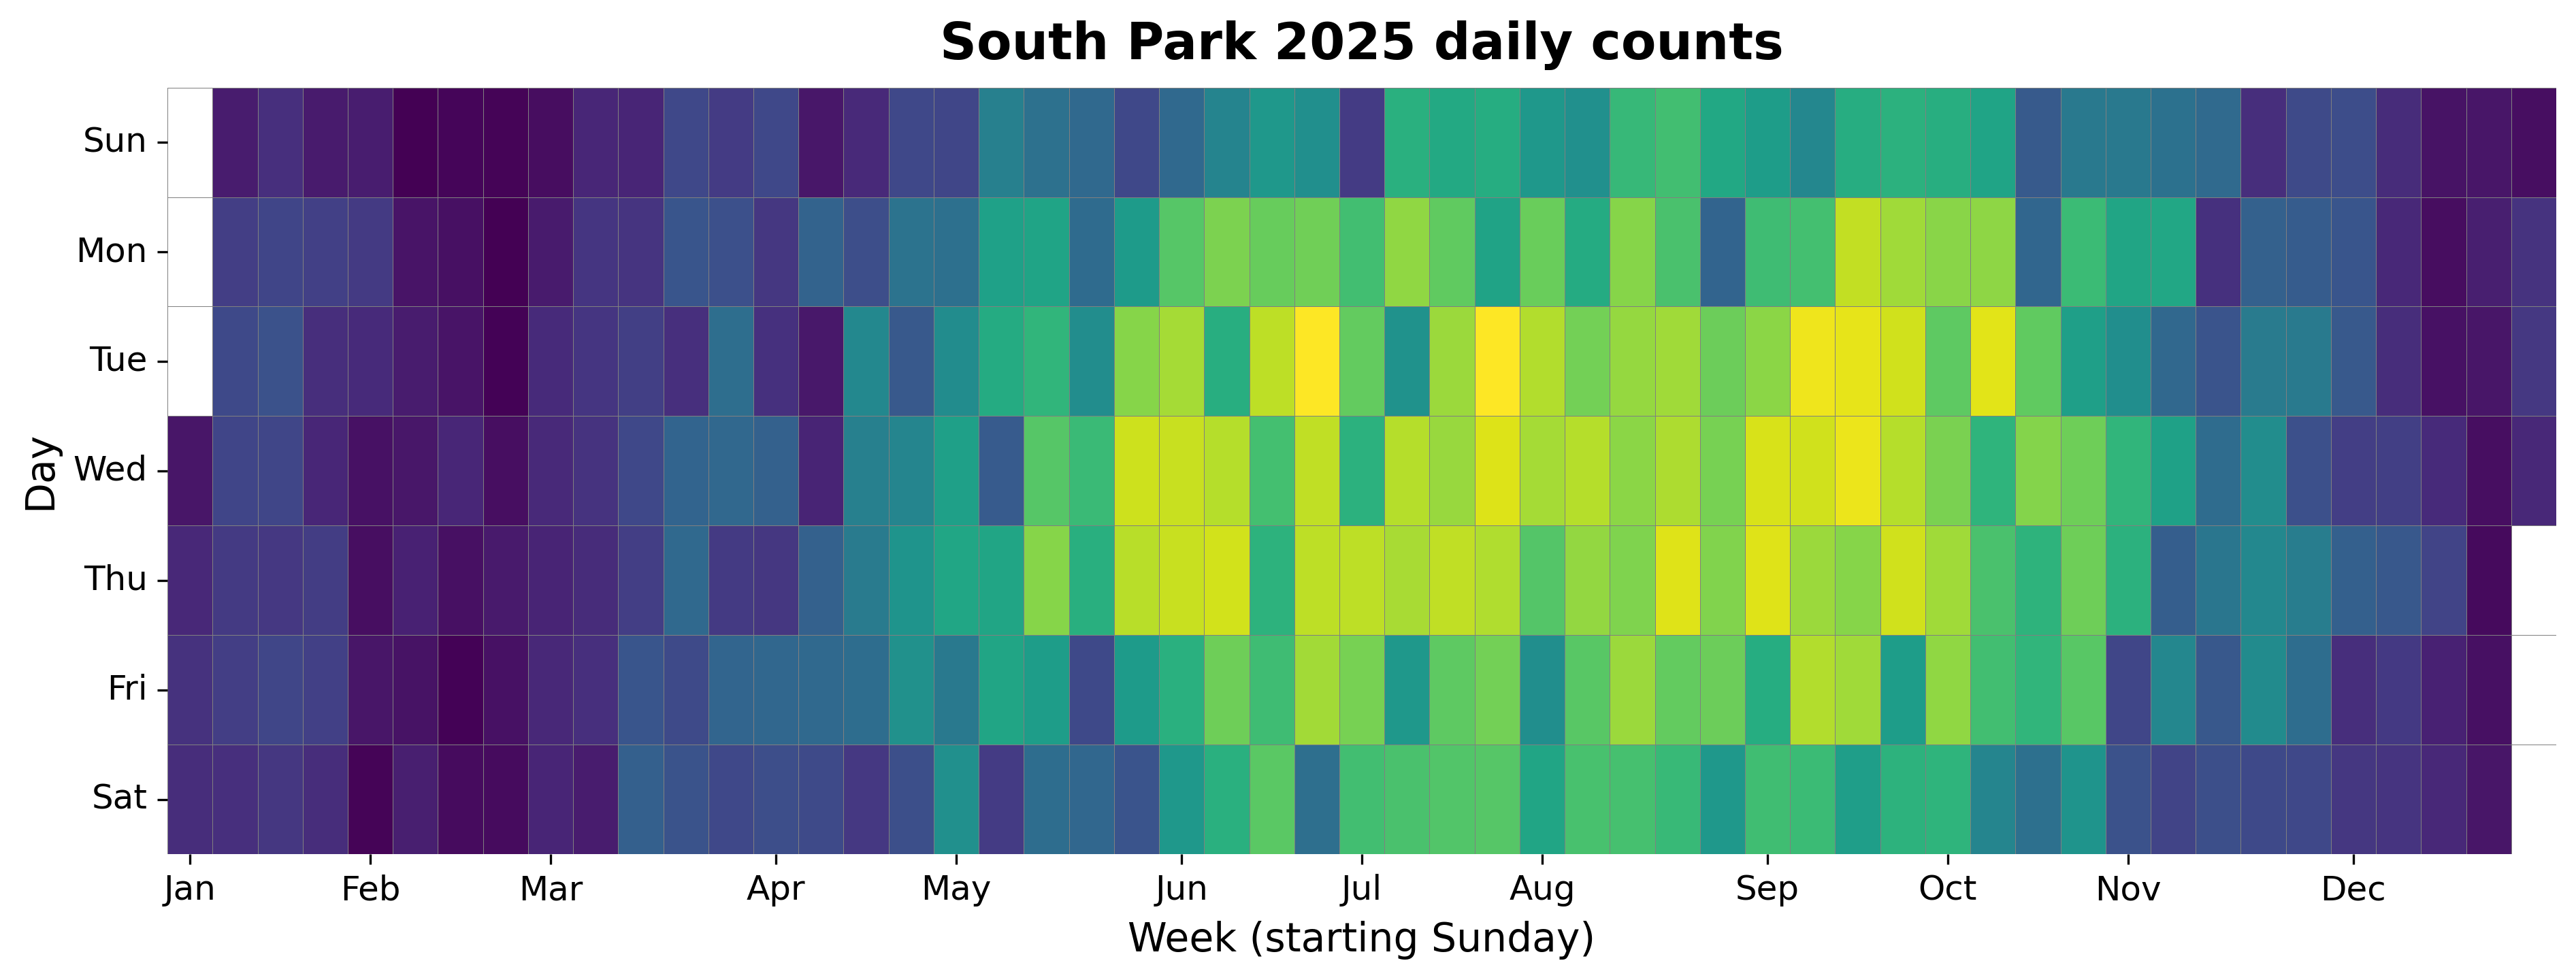
2025 Daily Heatmap
Each cell shows the daily count for a week/day combination.
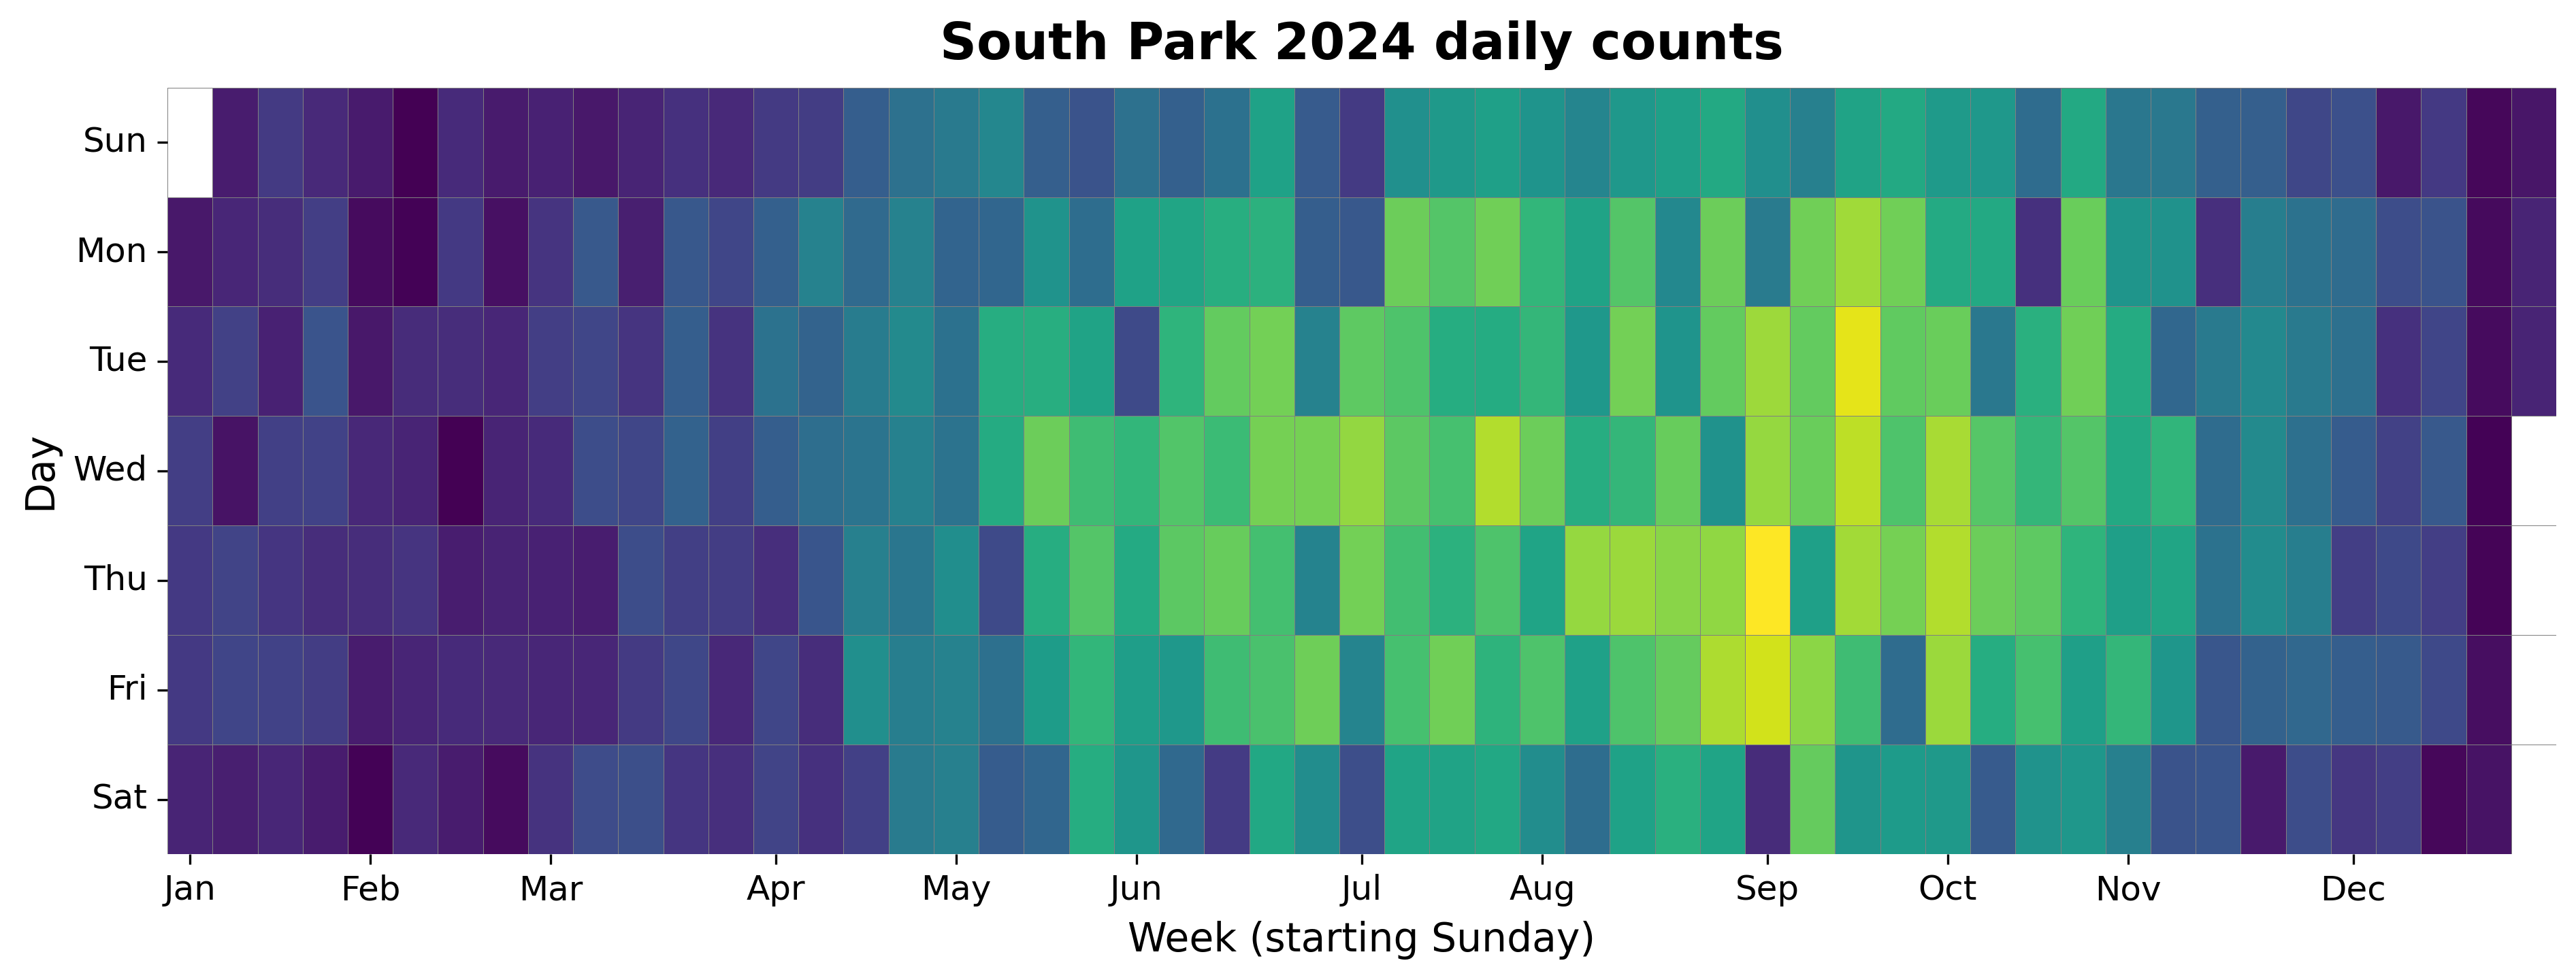
2024 Daily Heatmap
Each cell shows the daily count for a week/day combination.
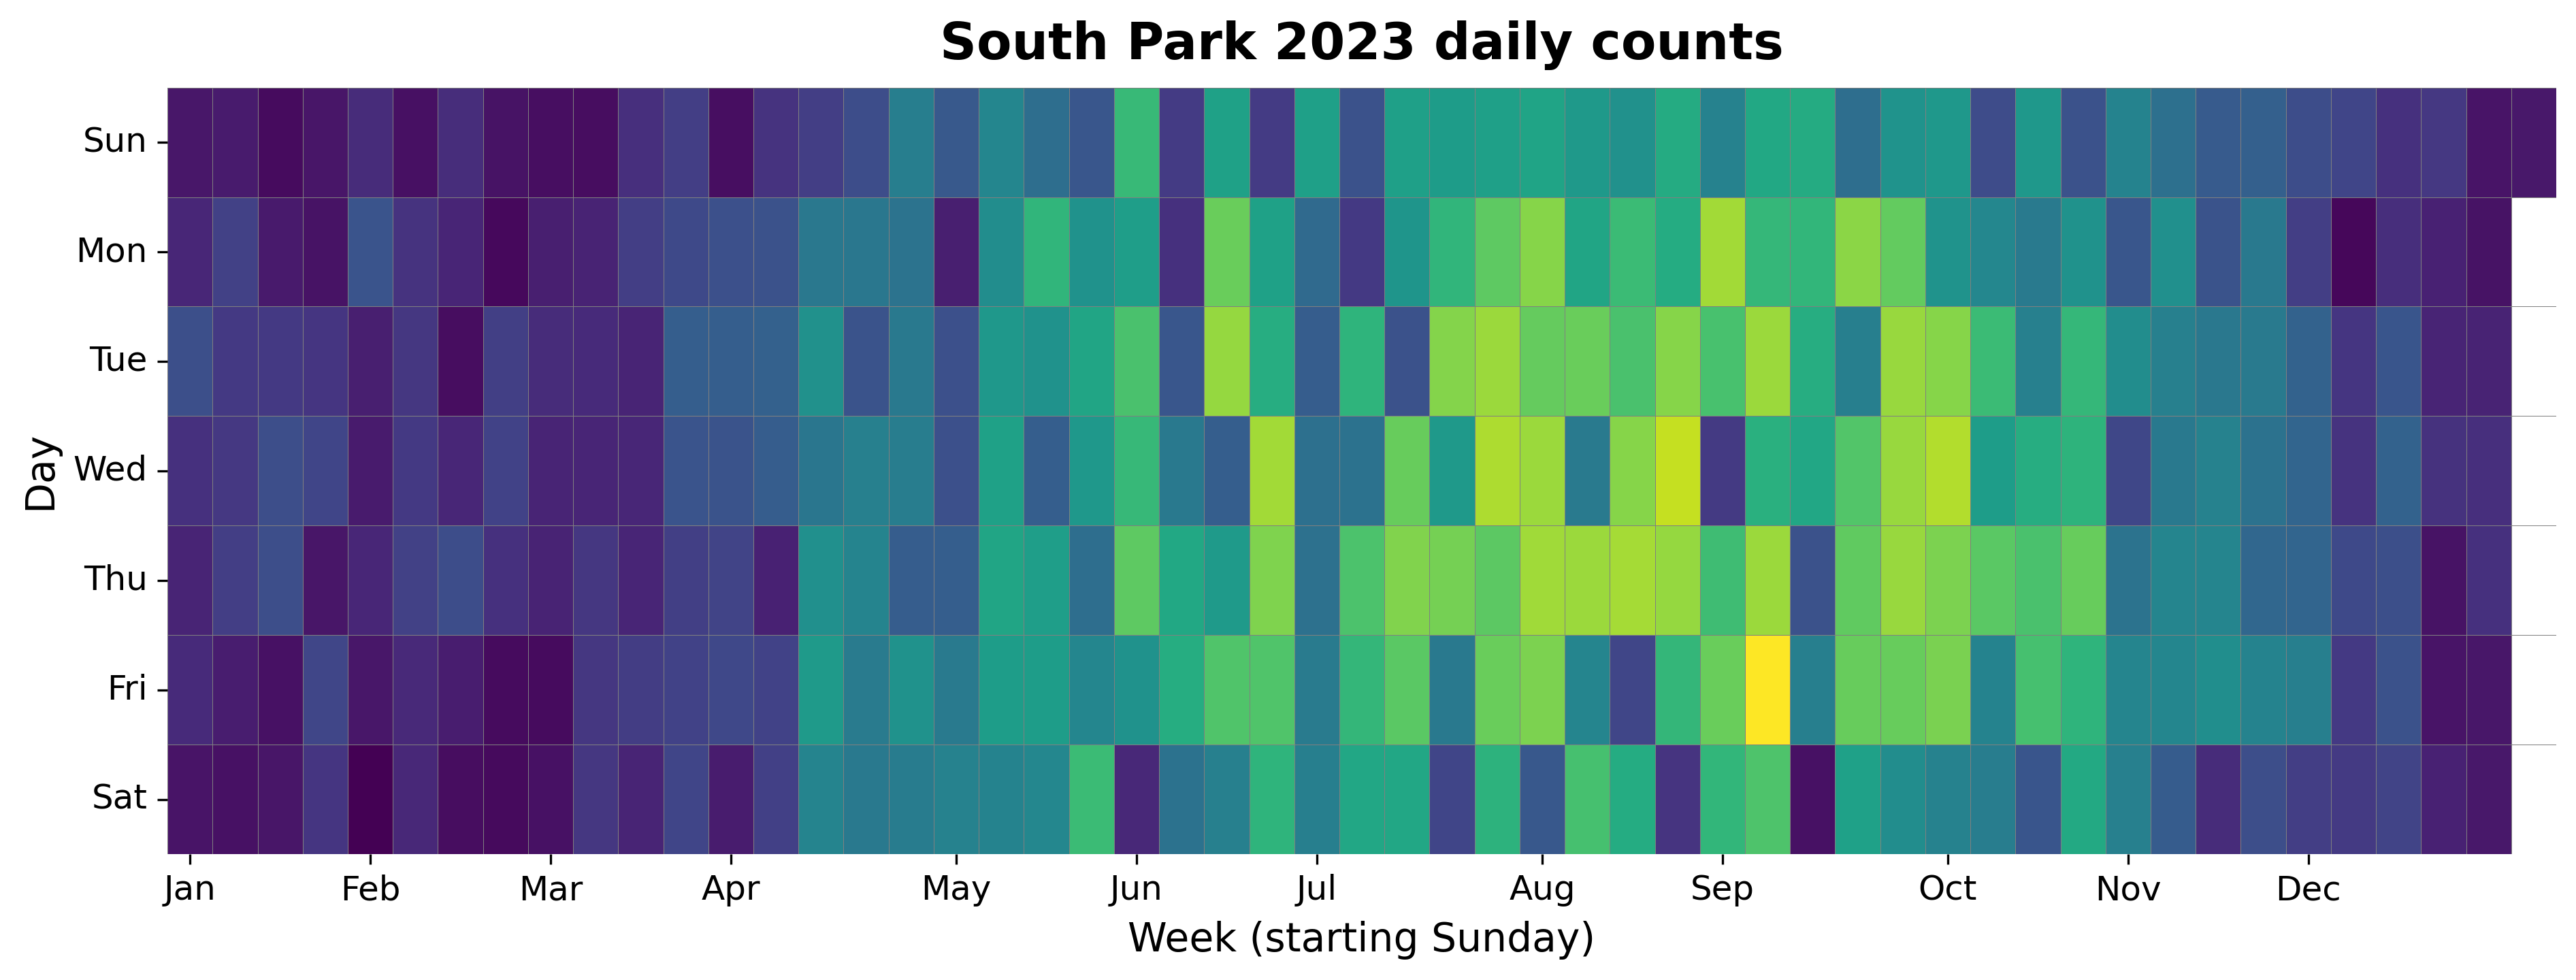
2023 Daily Heatmap
Each cell shows the daily count for a week/day combination.
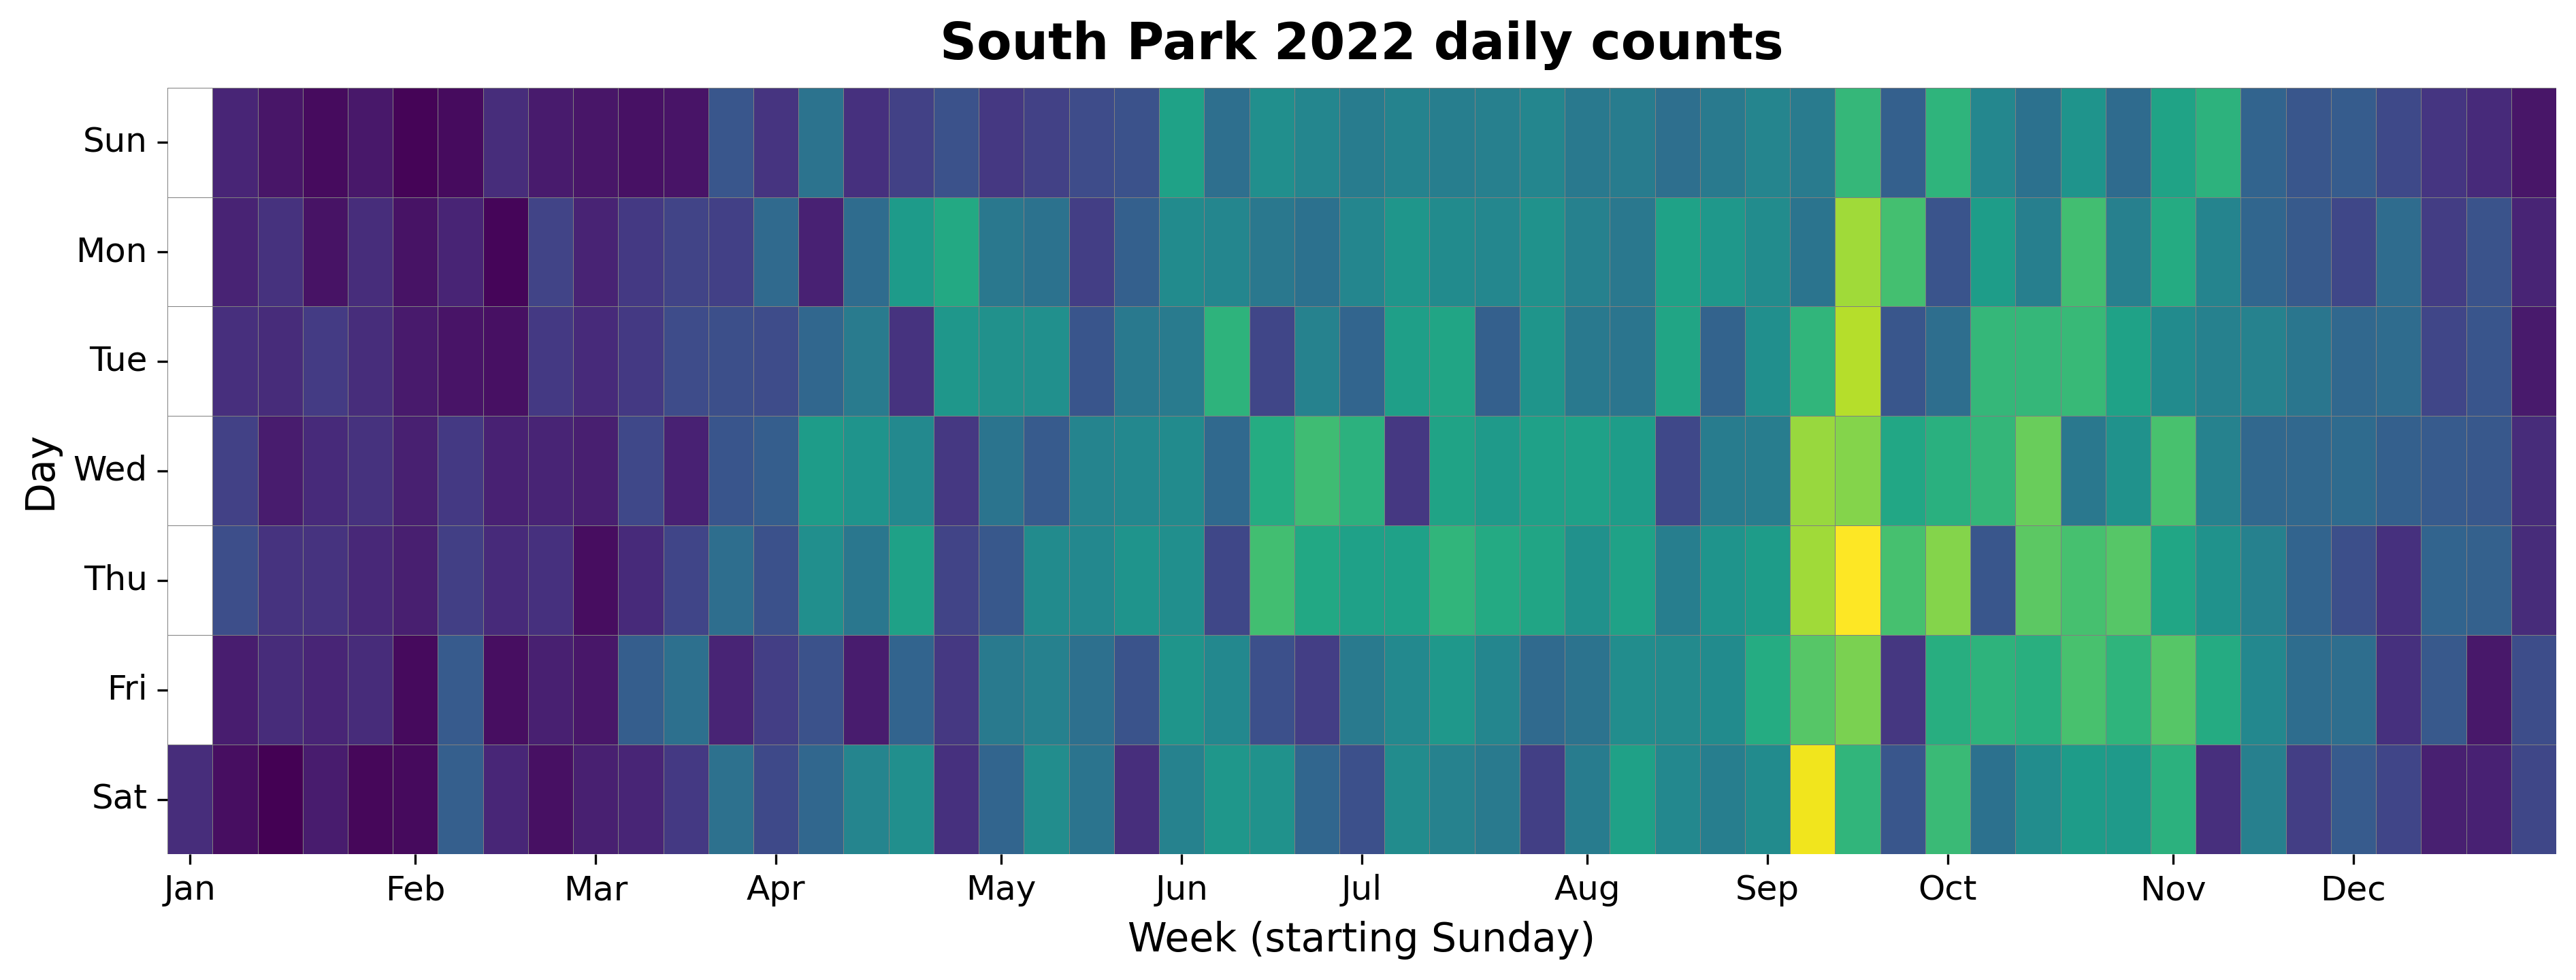
2022 Daily Heatmap
Each cell shows the daily count for a week/day combination.
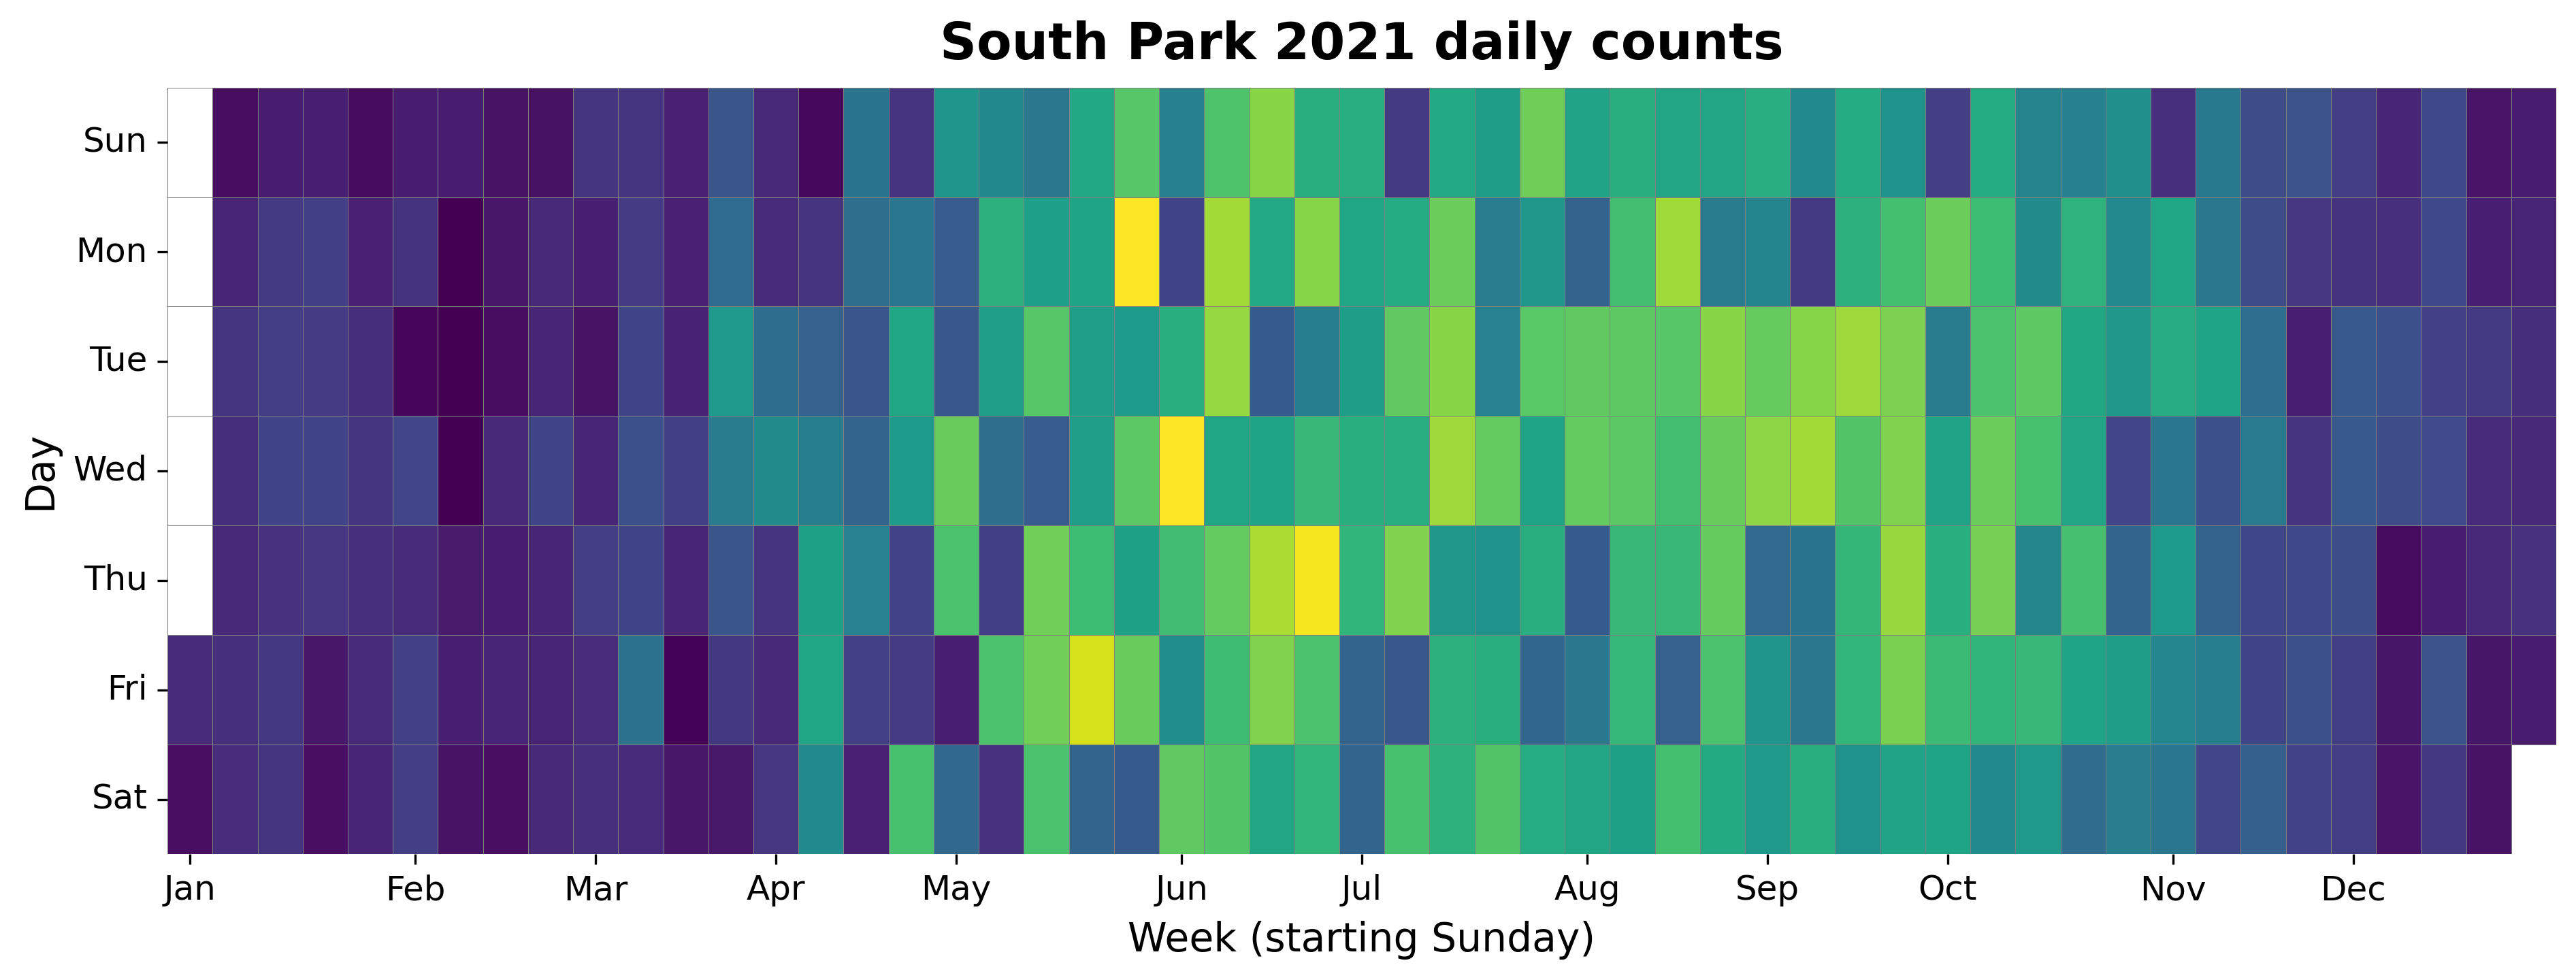
2021 Daily Heatmap
Each cell shows the daily count for a week/day combination.
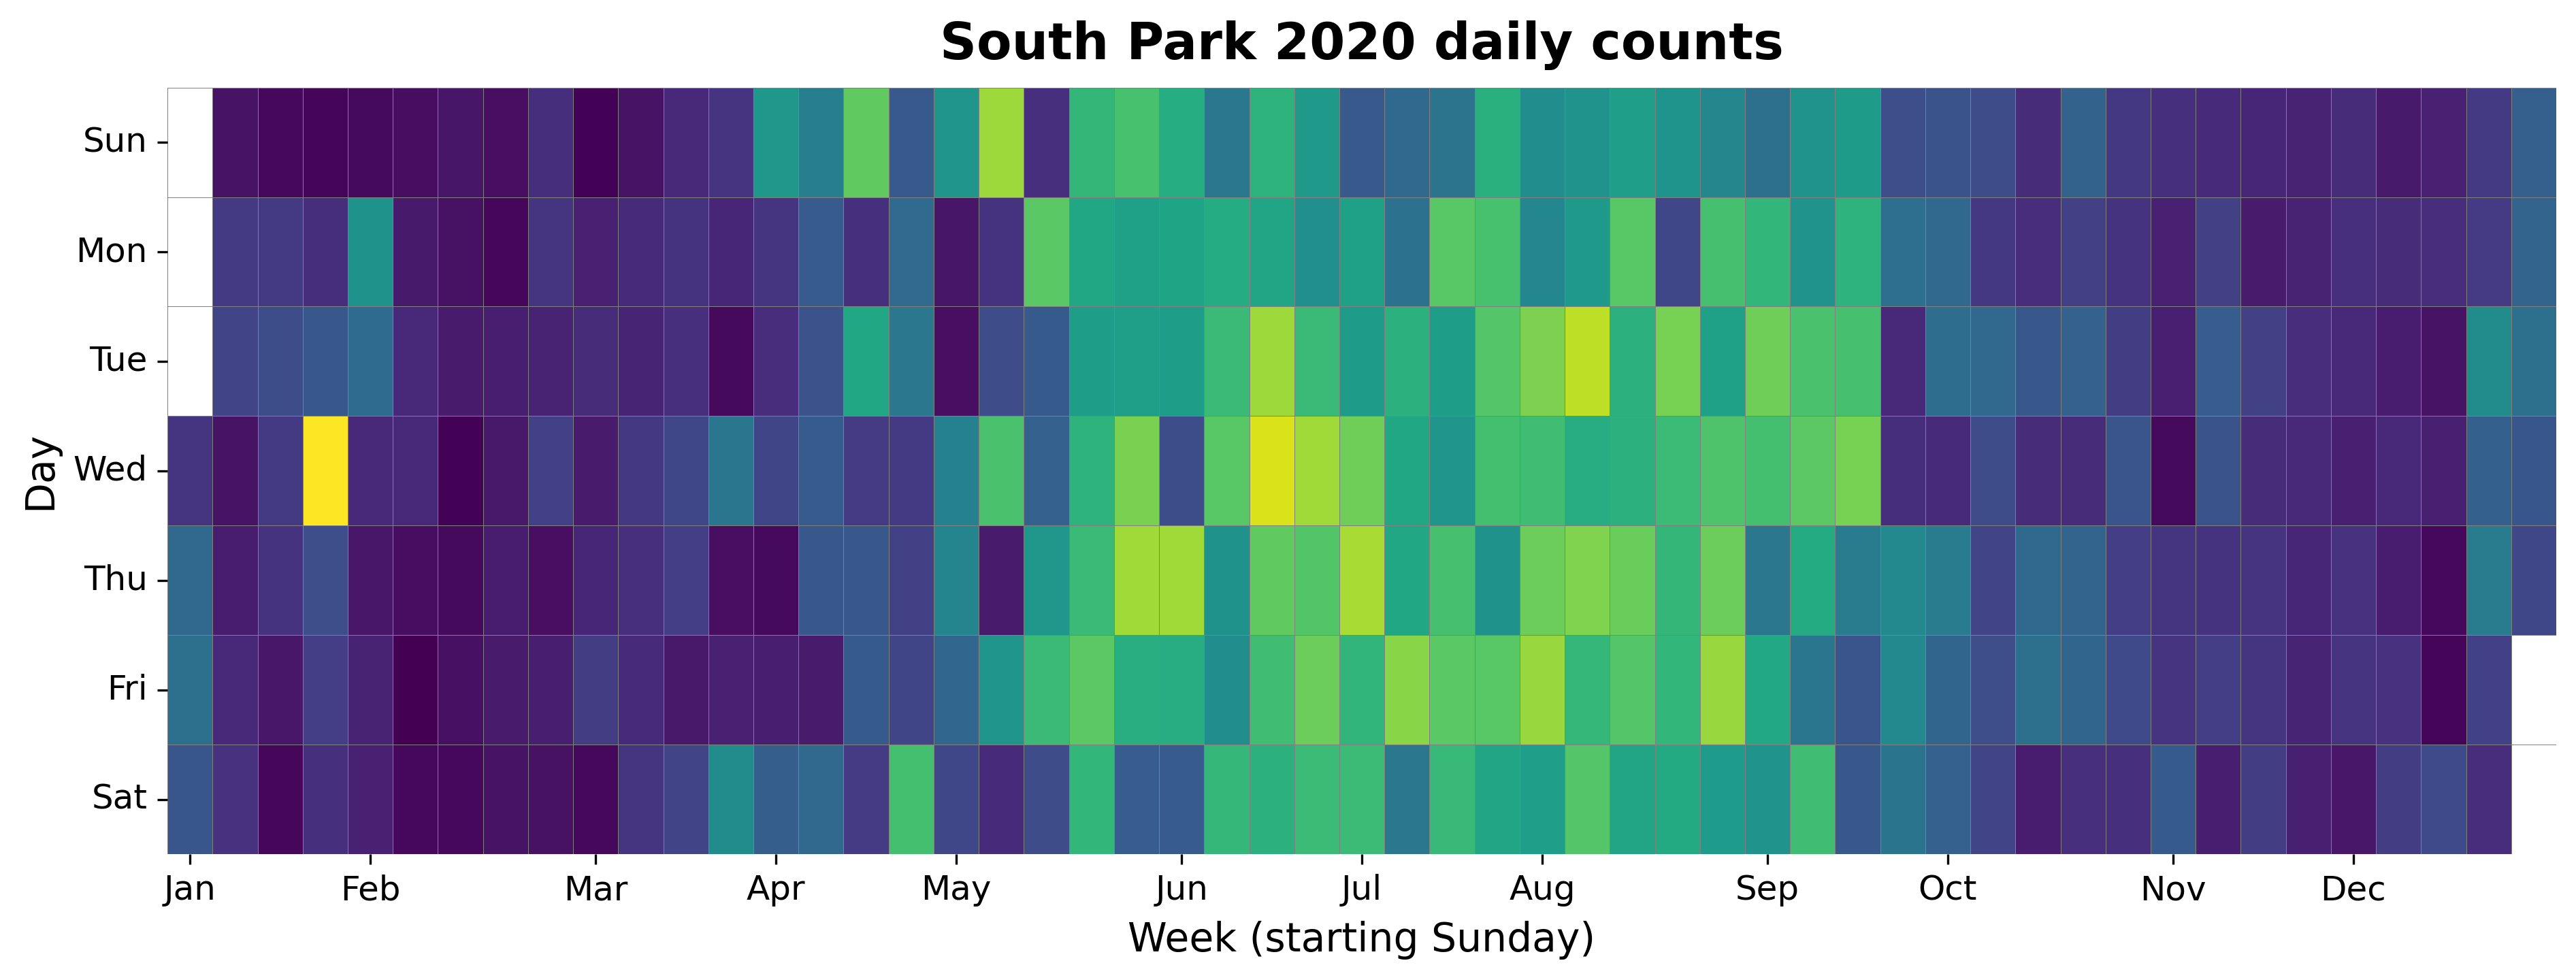
2020 Daily Heatmap
Each cell shows the daily count for a week/day combination.
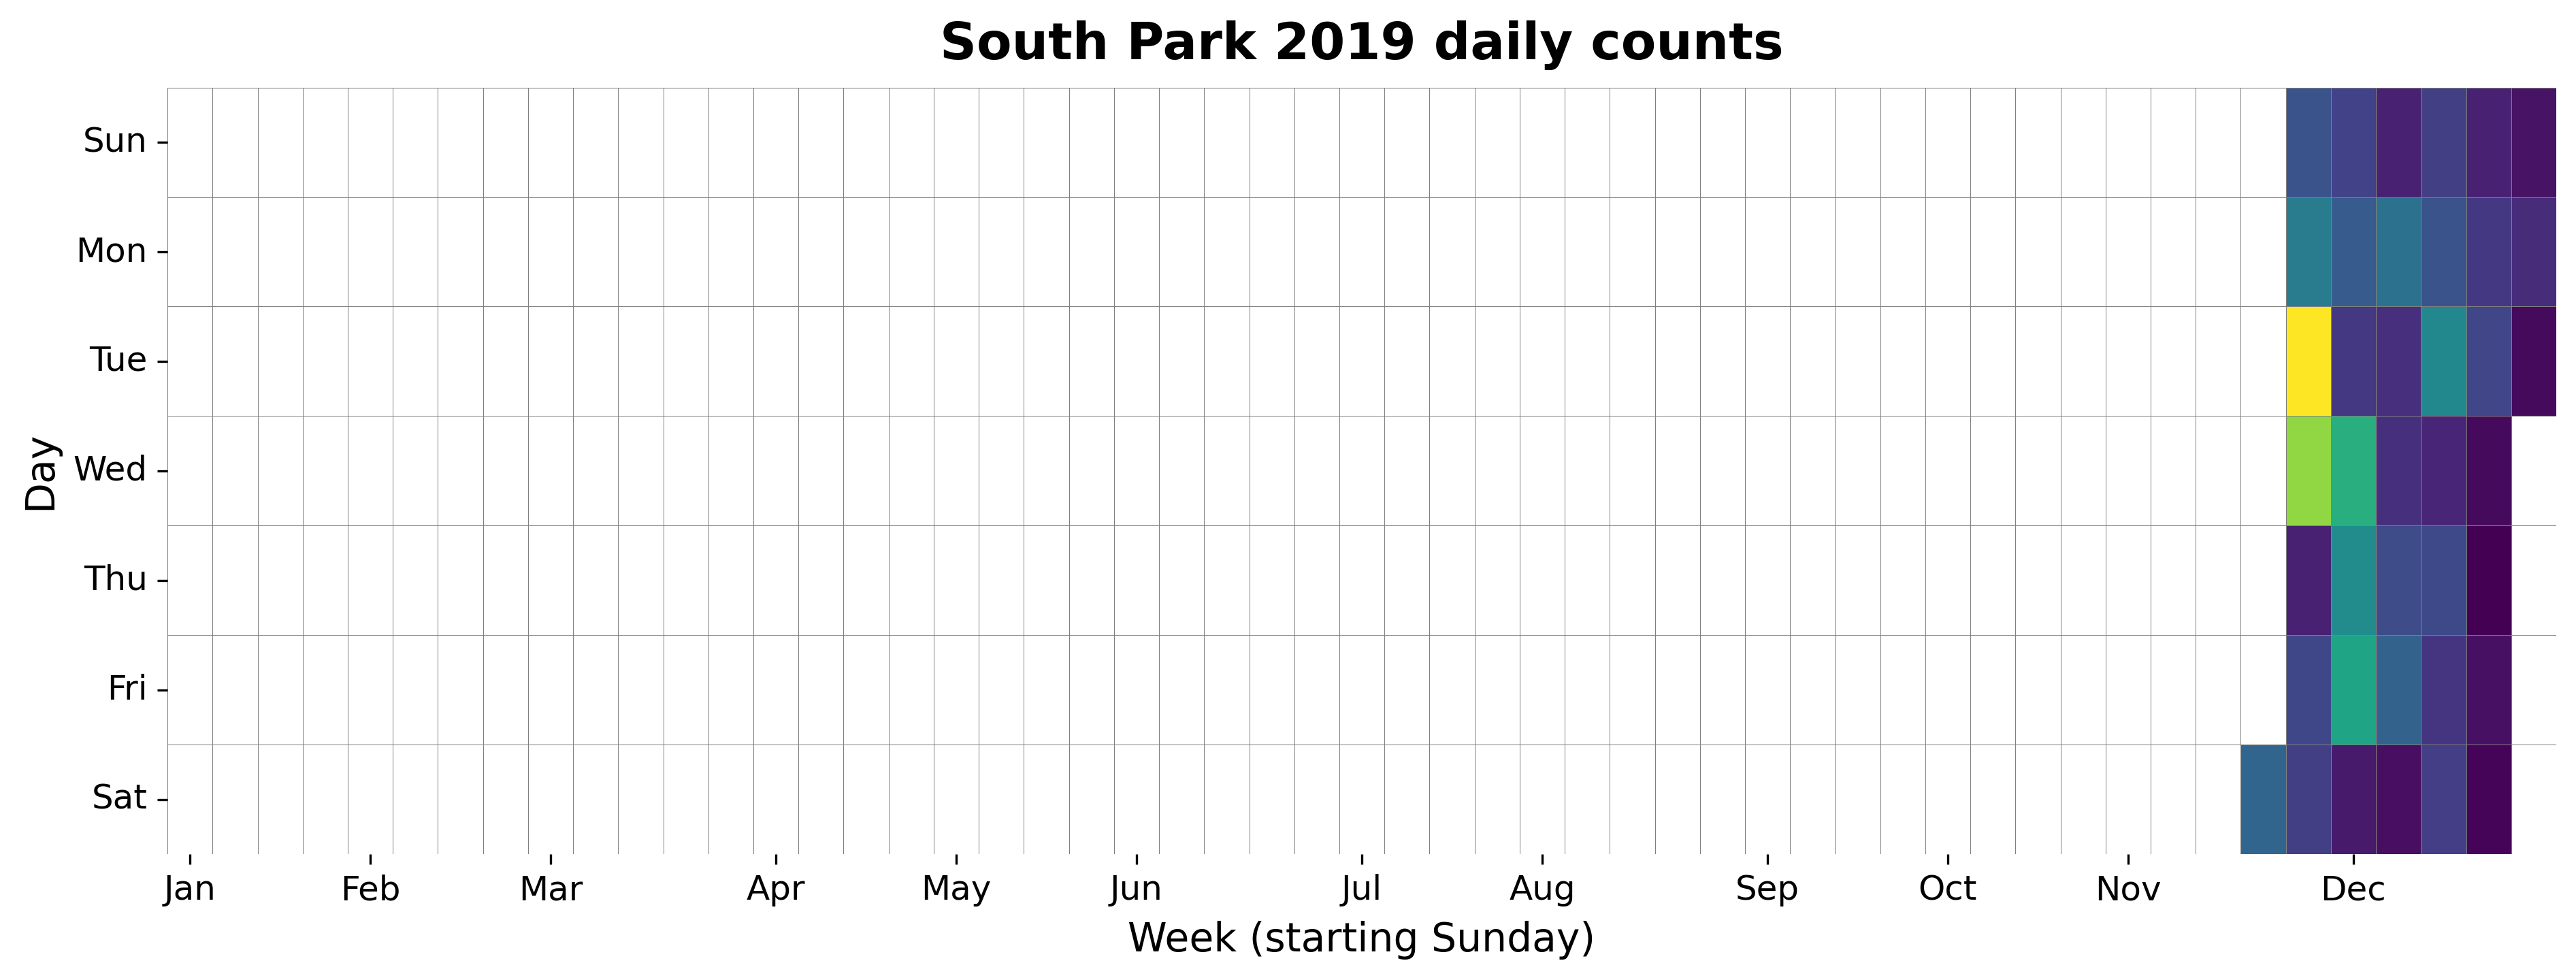
2019 Daily Heatmap
Each cell shows the daily count for a week/day combination.
Top Days
| Day | Count |
|---|---|
| 2025-07-22 | 723 |
| 2025-06-24 | 723 |
| 2024-09-05 | 720 |
| 2025-09-09 | 705 |
| 2025-09-17 | 703 |
| 2025-09-16 | 695 |
| 2025-10-07 | 690 |
| 2024-09-17 | 690 |
| 2025-09-04 | 689 |
| 2025-08-21 | 687 |
Top Weeks
| Week Starting | Count |
|---|---|
| 2025-09-14 | 4,125 |
| 2025-07-20 | 4,018 |
| 2025-08-17 | 3,998 |
| 2025-08-10 | 3,993 |
| 2025-09-07 | 3,969 |
| 2025-07-13 | 3,938 |
| 2025-09-21 | 3,933 |
| 2025-09-28 | 3,869 |
| 2024-09-15 | 3,866 |
| 2025-06-22 | 3,840 |
Top Months
| Month | Count |
|---|---|
| 2025-07 | 17,048 |
| 2025-09 | 17,037 |
| 2025-08 | 16,185 |
| 2025-06 | 15,355 |
| 2024-09 | 14,857 |
| 2024-08 | 14,469 |
| 2024-07 | 14,468 |
| 2025-10 | 14,003 |
| 2024-10 | 13,655 |
| 2021-06 | 13,599 |